Multi-Source Queries
Ultorg perspectives can combine data from multiple data sources. To add a table from a different data source to the current perspective, use the Custom Join action in the usual manner. You can select a table in any data source as the Child Table.
Example: Joining Database Tables and a CSV File
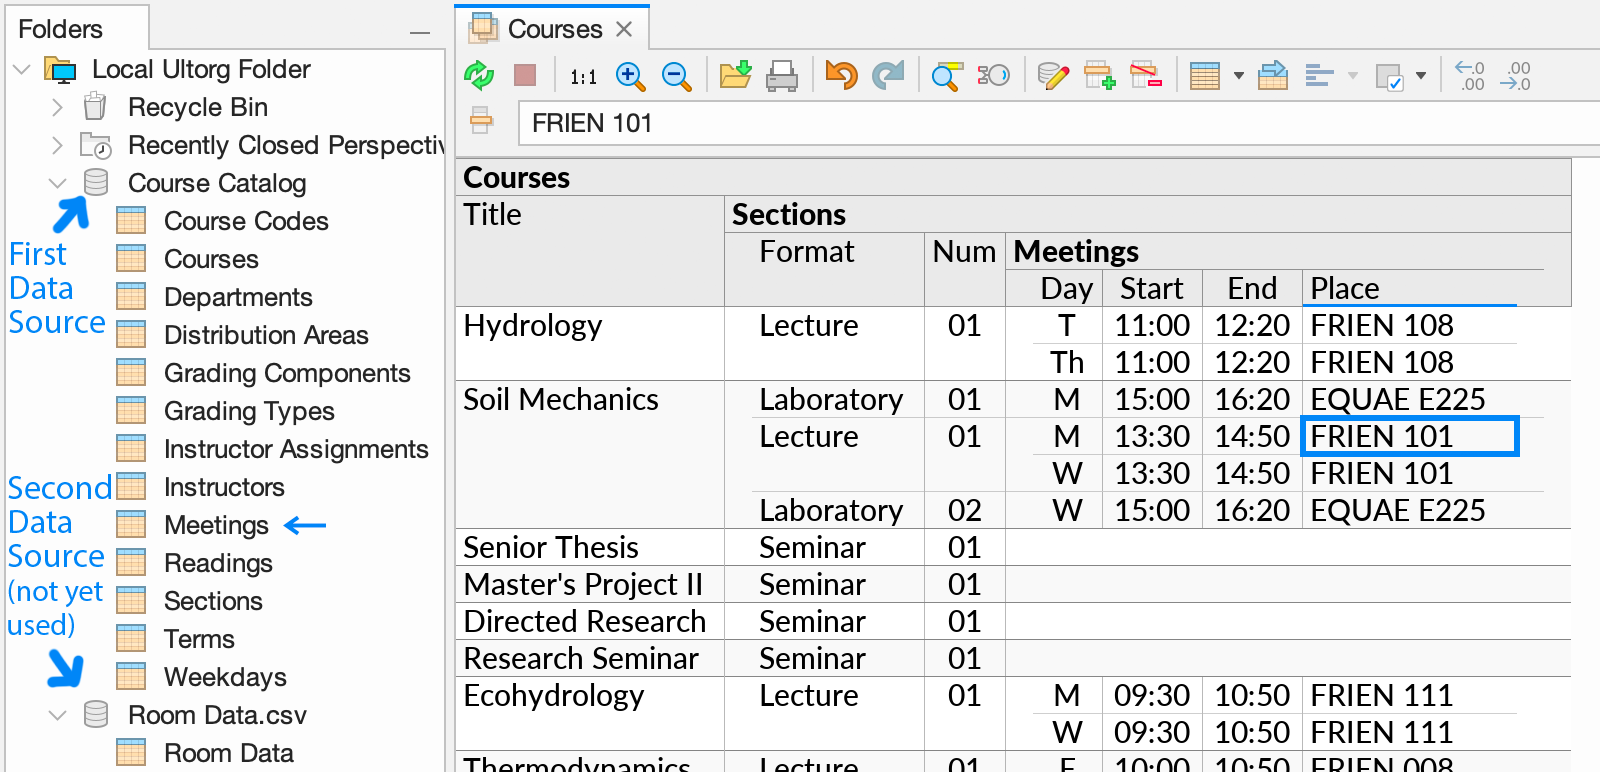
For example, we might start with the following perspective, which shows Courses and Sections/Meetings in an academic course catalog:
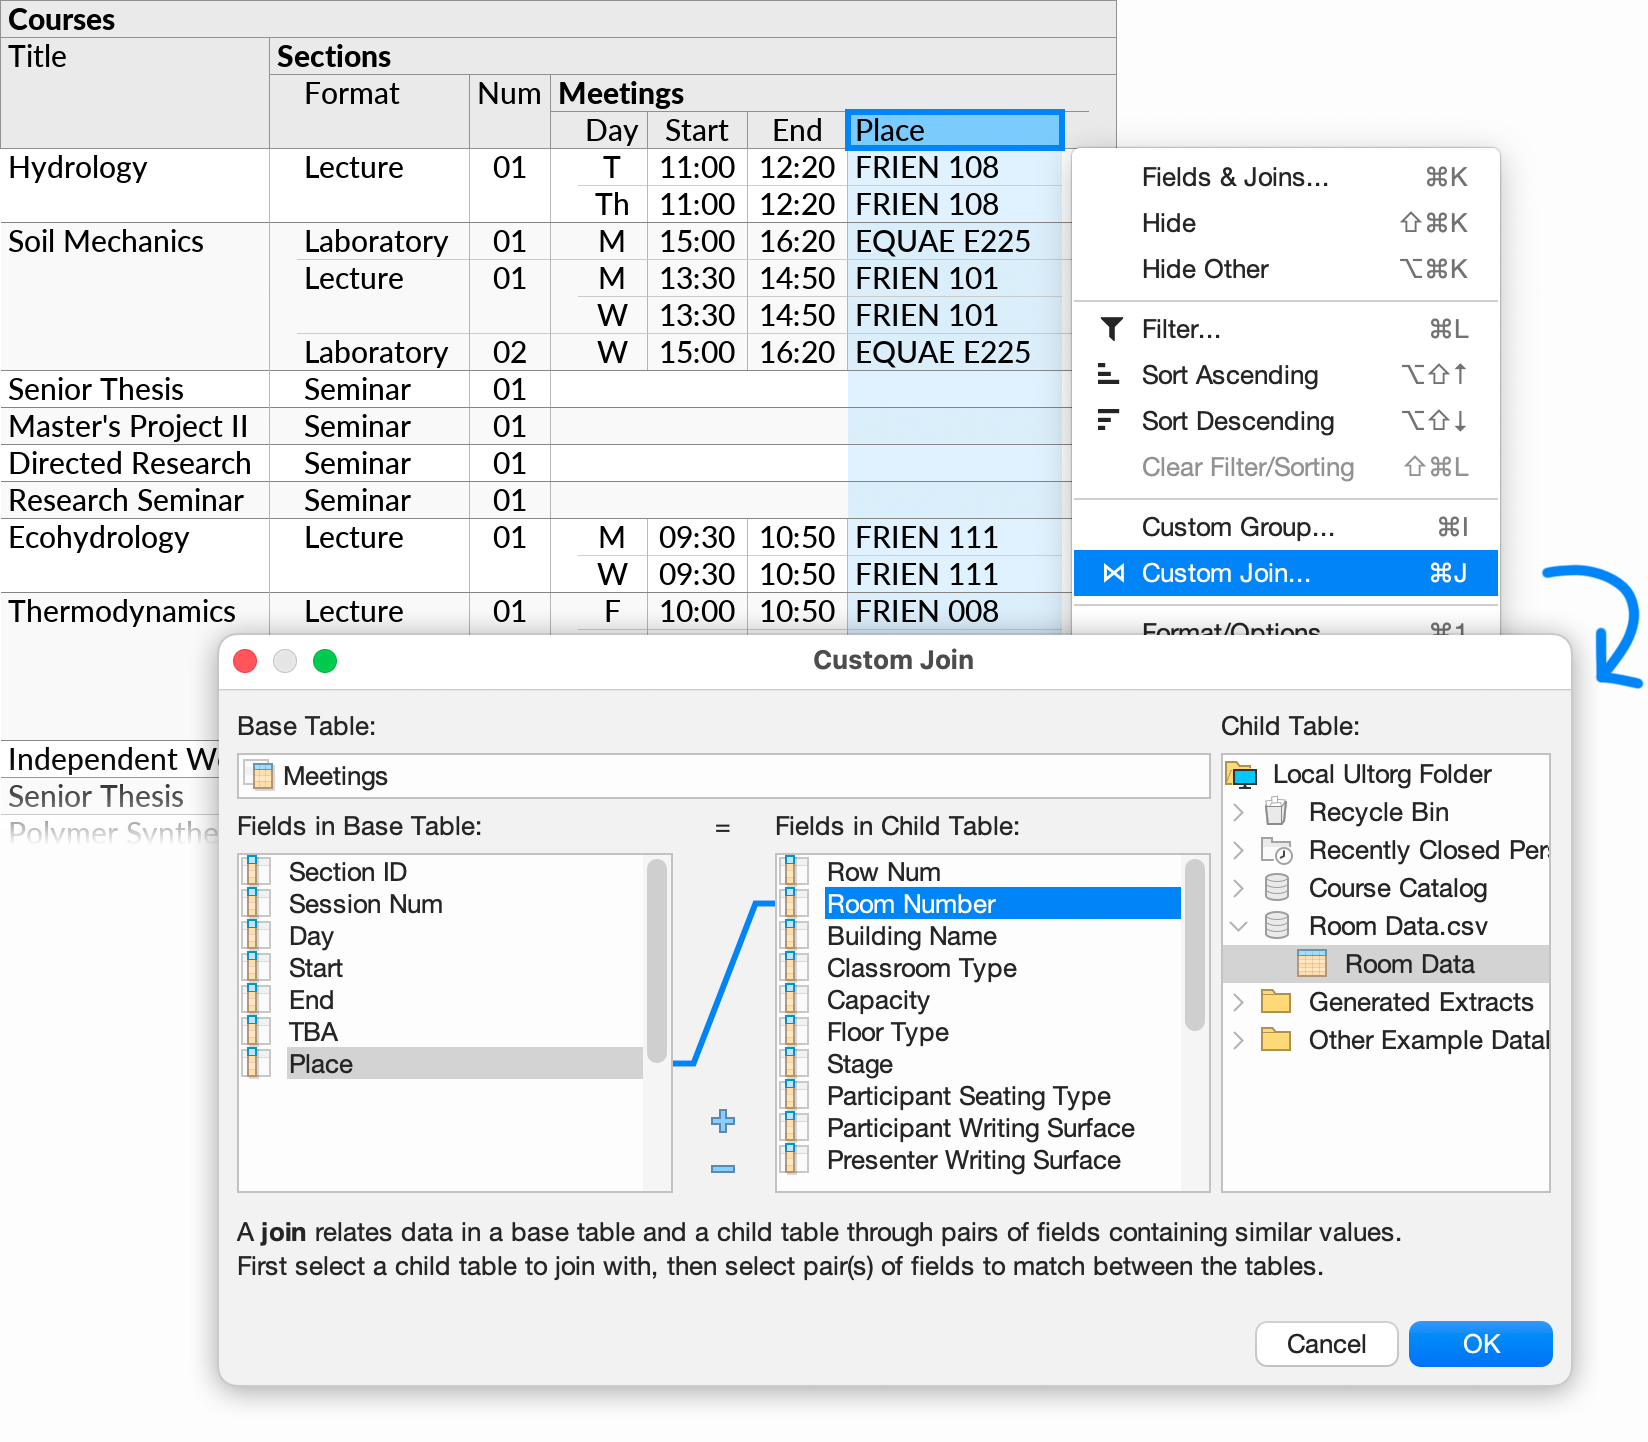
Suppose we have, separately, a CSV file containing additional information about individual rooms. To include this information in the perspective, we first add the CSV file as a separate data source, as can be seen in the Folders sidebar above. Then, we invoke Custom Join on the “Place” field, and select the table in the CSV file, and the “Room Number” field in the latter:
Clicking OK, a new “Room Data” subquery appears with data from the CSV file:
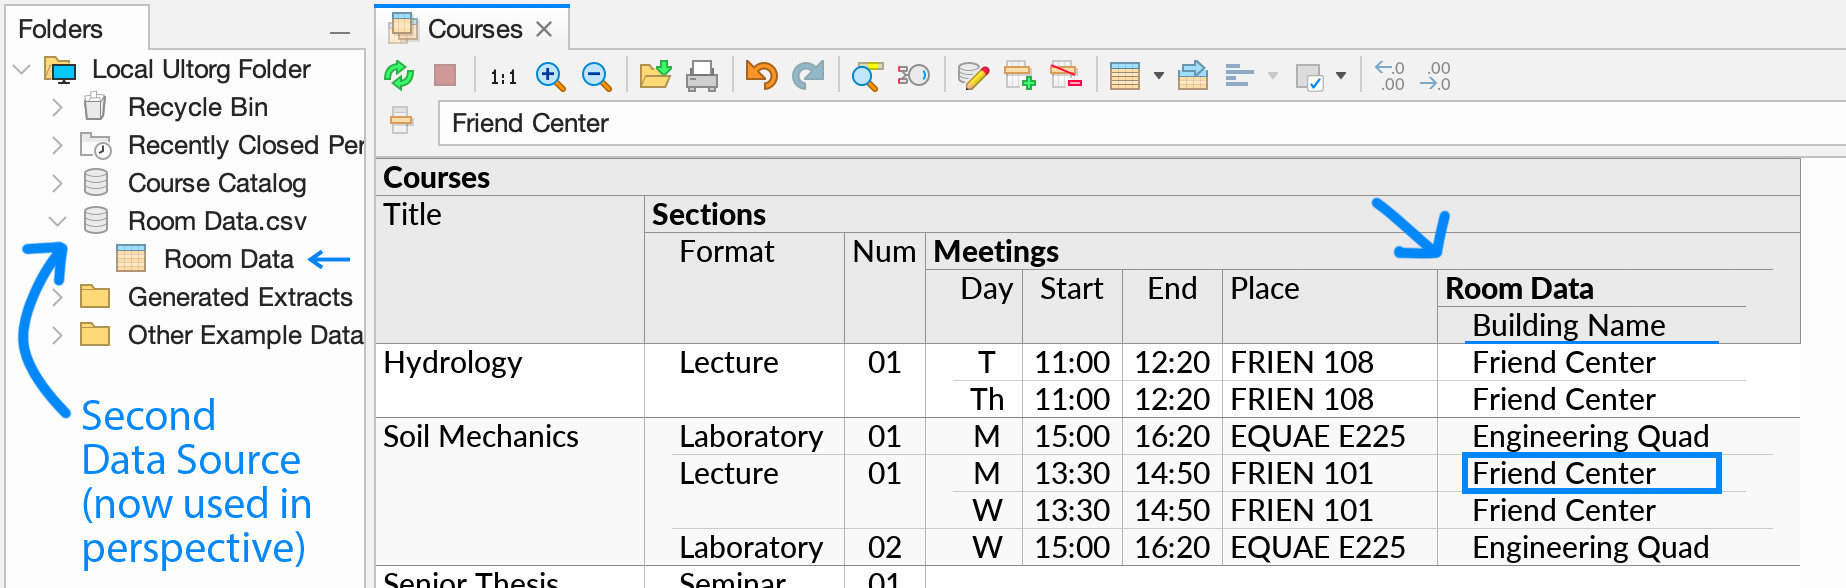
The blue arrow in the Folders sidebar (![]() ) shows which table and data source the data under the cell cursor comes from.
) shows which table and data source the data under the cell cursor comes from.
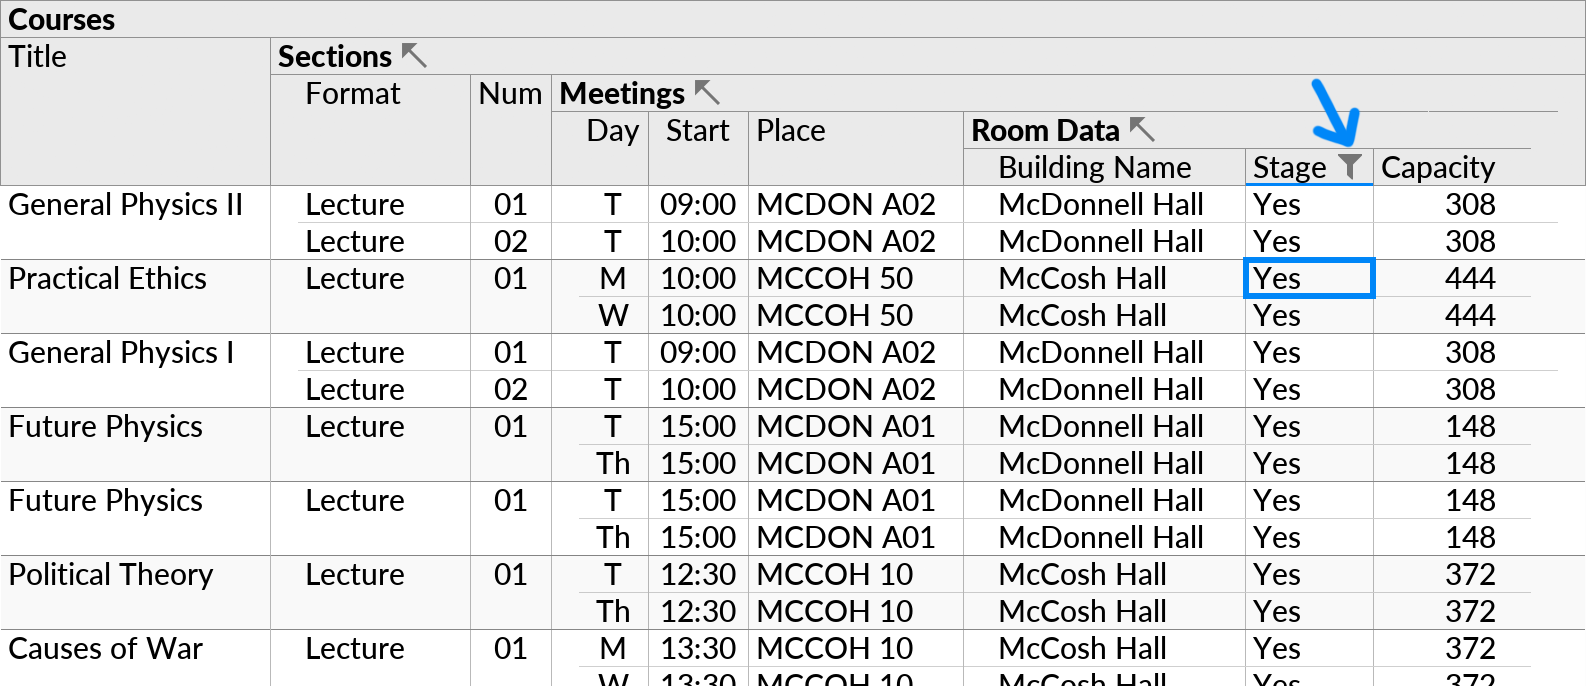
We can make additional fields from the CSV file visible with the field selector, and then proceed with other actions. For example, we can make the “Stage” field visible, and then filter to find only courses that are taught in rooms with a stage:
How it Works
Behind the scenes, Ultorg handles multi-source queries by creating extracts of the required data tables and running queries on your local computer. You can click Refresh Data (![]() ) to refresh extracted data if necessary.
) to refresh extracted data if necessary.
Annotating External Data
It is often useful to combine data in an external data source with supplemental data that you prepare yourself. Such data can be provided, for instance, in an Excel file or in Google Sheets.
You can also edit the supplemental data directly from Ultorg, and write changes back to the original spreadsheet.
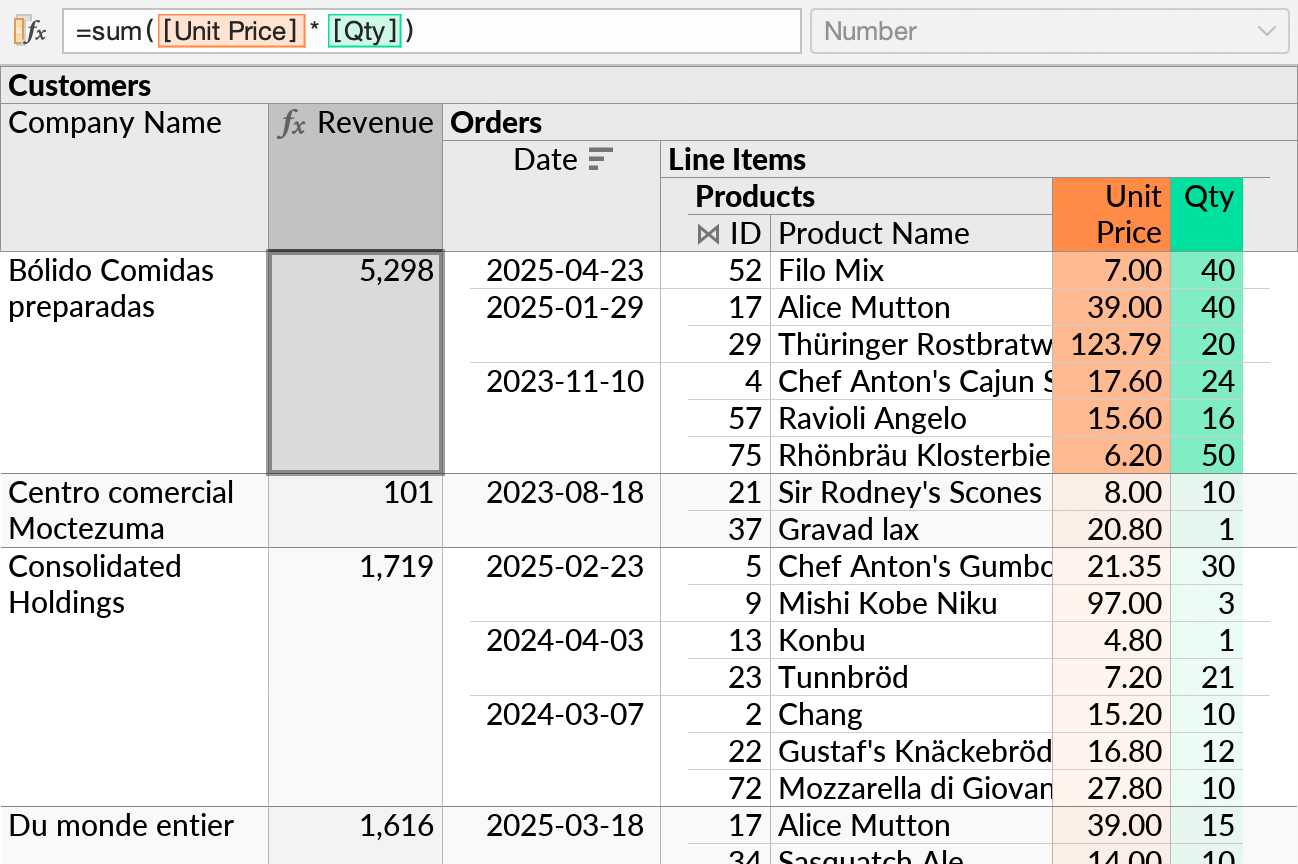
Example: What-If Forecasting
Suppose we have a read-only database of products and orders, and want to simulate the effects of future price changes.
An initial perspective might join tables such as Customers, Orders, Line Items, and Products, and calculate the total revenue per customer:
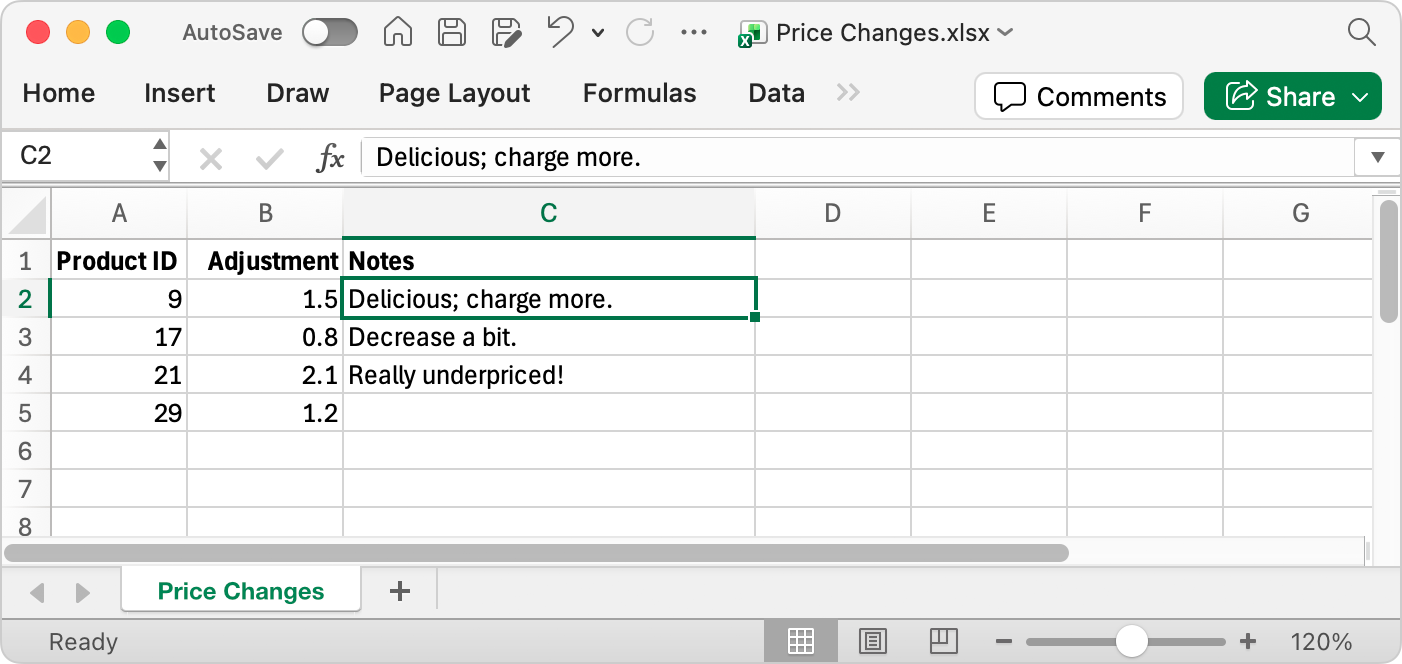
To store our pricing adjustments, we create a separate table in Excel, with columns named Product ID, Adjustment, and Notes. We fill in a few rows to start with, so that Ultorg can detect the data type of each column:
In Ultorg, we connect to the Excel file by clicking Add Data Source→Connect to File.
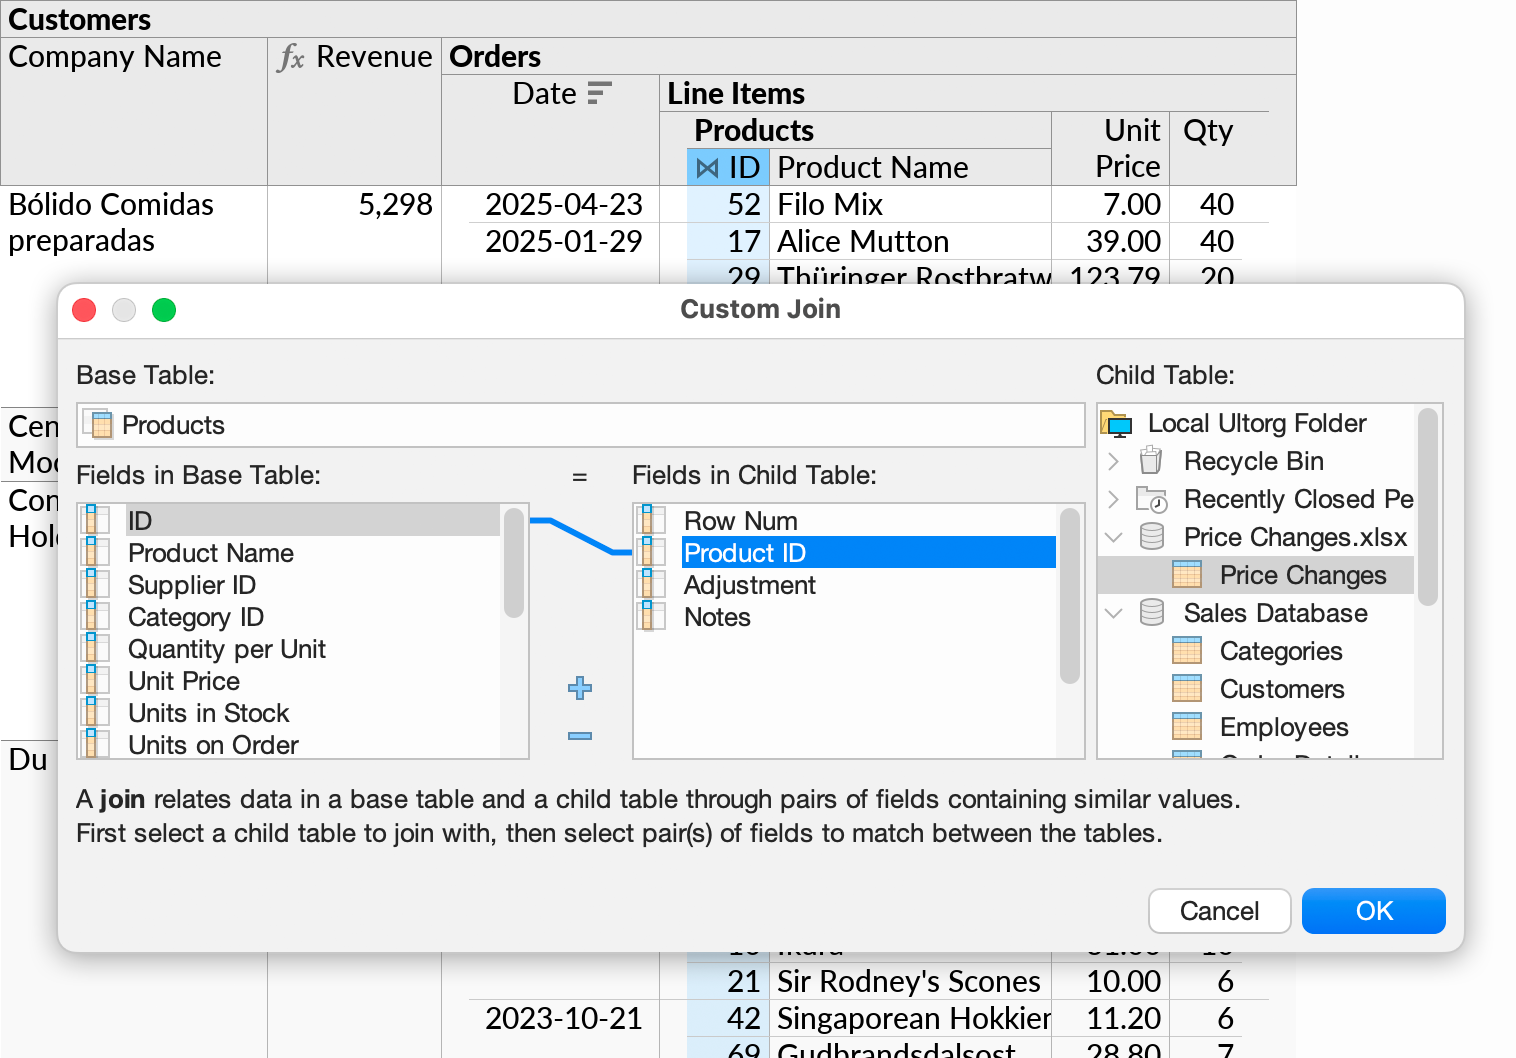
Then, in our existing perspective, we select the “ID” column under Products, click Custom Join in the context menu, and join on the “Product ID” column in our spreadsheet table.
Data from the Price Changes table will appear as a new subquery under Products:
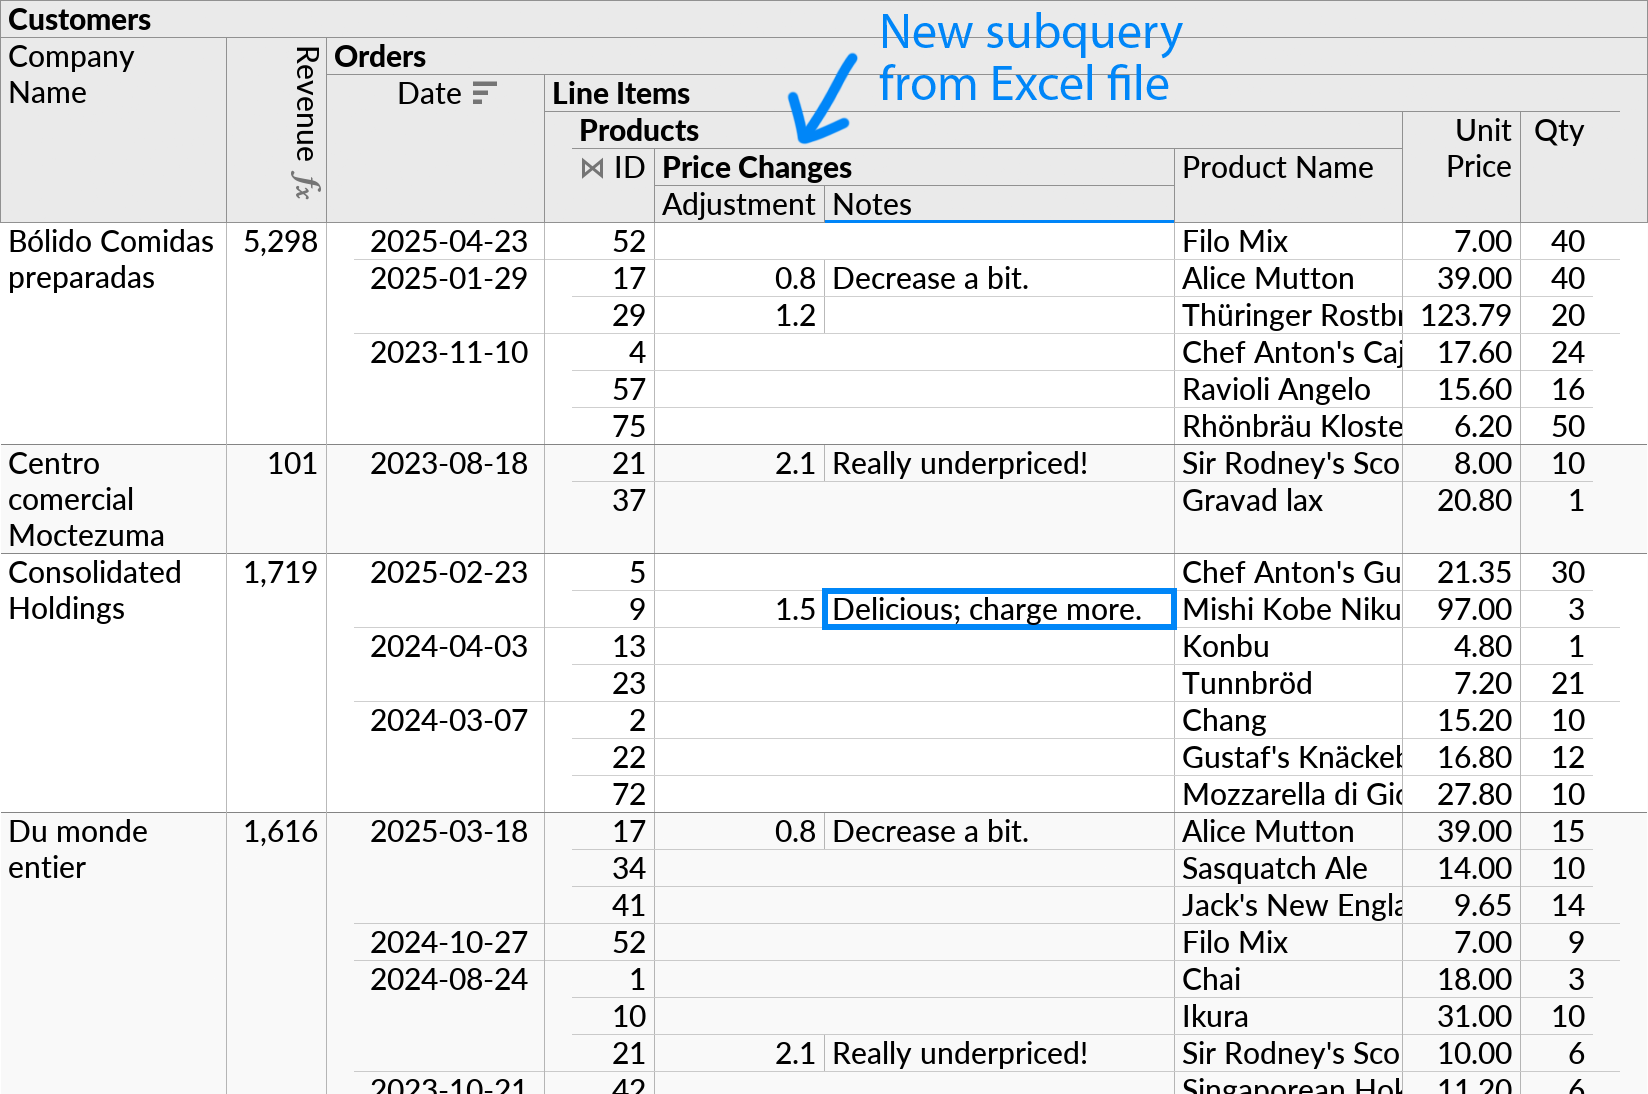
A single row from the Price Changes table can appear in multiple positions, if the related product is referenced from multiple orders (e.g. “Alice Mutton”).
Now we can insert a formula that estimates total revenue per customer with the proposed pricing adjustments. We use the ifnull function to set a default multiplier of 1 for products that do not have an entry in our Excel sheet.
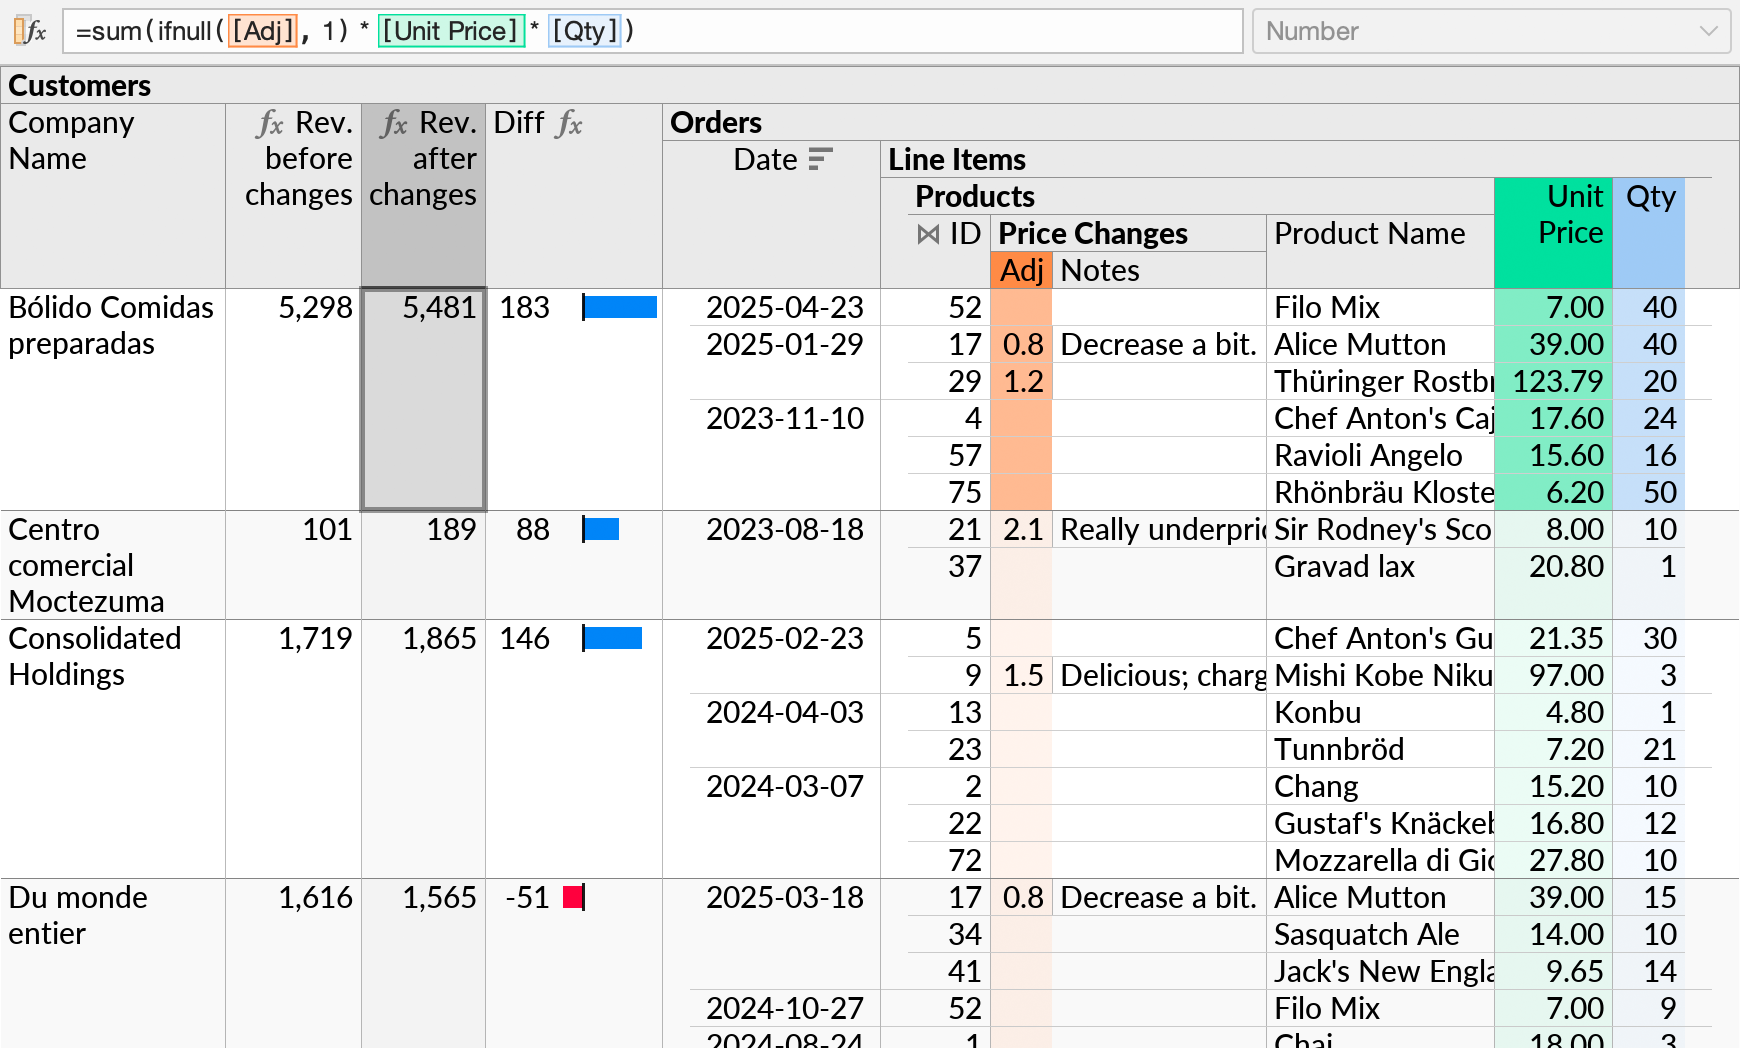
We have also added a formula showing the difference in revenue before and after the price changes, for each customer, with an inline bar chart (![]() ).
).
Further price adjustment entries can now be made from Ultorg, in the context of all the other data that that is visible in the perspective.
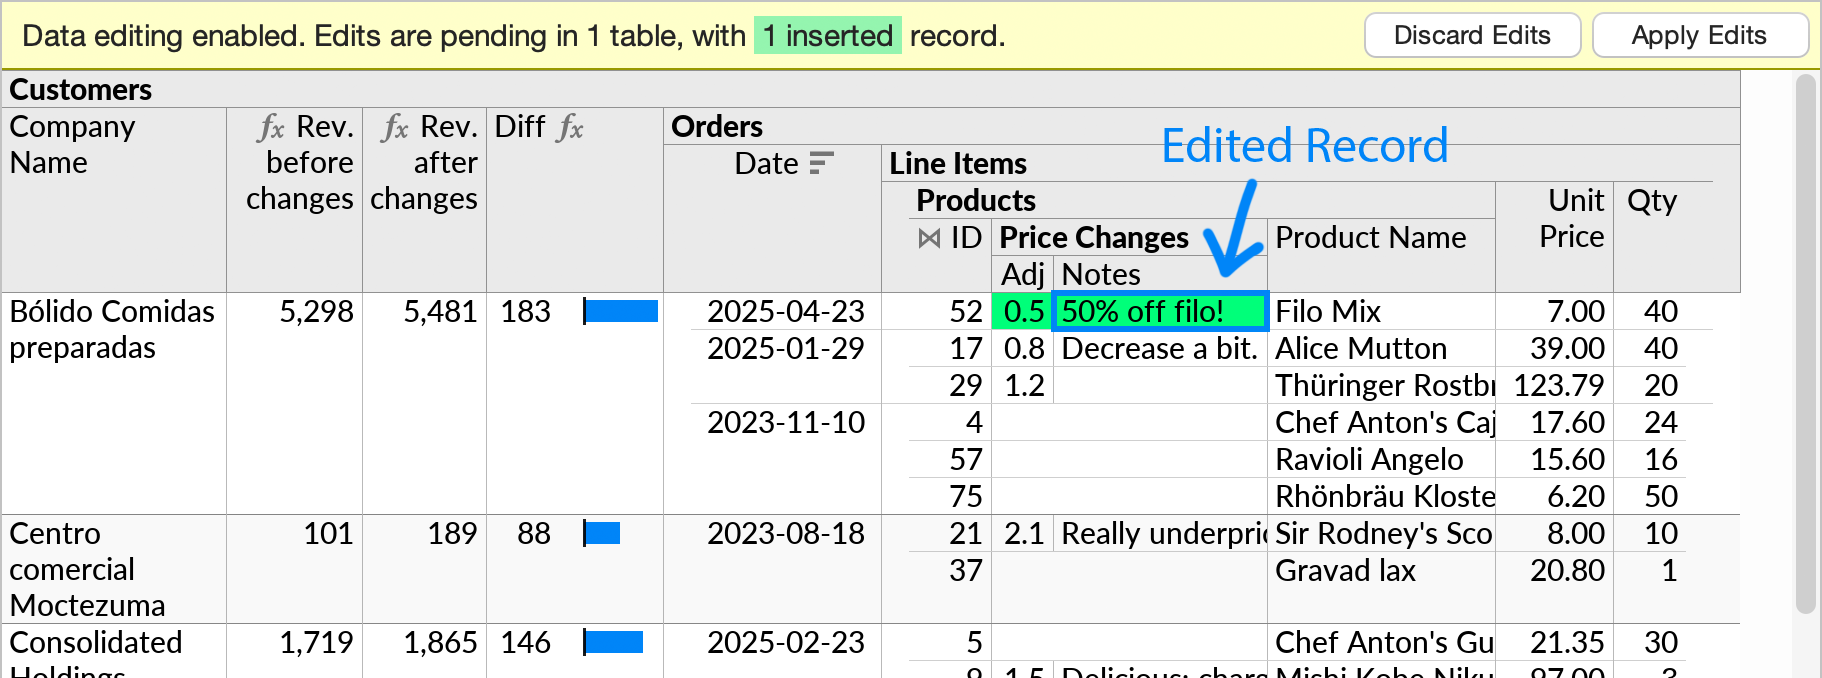
When Apply Edits is pressed, the edits will be written to the Excel file, and formulas will recalculate. See Data Editing Basics for more information.
Demo Video
The example above is featured in the following demo video.