The missing user interface for
Ultorg is an efficient, spreadsheet-like UI for relational databases. Query and edit data across tables and relationships, without SQL or custom CRUD apps. Watch the conference talk.
MacOS | Windows | Linux
14-day free trial
Explore, combine, query, and edit data in spreadsheets and relational databases:


 Matías Fernández@matias__eduardo
@ultorg is the most mind blowing database tool I have ever seen. The way it can visualize multiple joins feels canonical in the sense that now, when I run complicated SQL queries, *that’s* the format I use to imagine the results. vimeo.com/695905306
 Gene Kim@RealGeneKim
Jaw dropping talk on a way to view SQL databases without writing a custom app.
Imagine Microsoft Access crossed with Microsoft Excel and a big dose of incredible sorcery
So exciting!! Can’t wait to learn more about @ultorg
 Justin Duke@jmduke
This presentation by @eirikbakke on a generic UI abstraction to navigate a relational database is the most exciting bit of interaction design I've seen in a long, long time.
vimeo.com/372006027
 Petri Aukia@aukia
The future never came: I expected dynamic multi-dimensional spreadsheet to sooner or later become the norm ever since I saw Lotus Improv.
With @ultorg you get to wonder – perhaps the multidimensional UI is to a set of database tables, not to a spreadsheet.
“Harmonic is building mathematical superintelligence. Deep, detailed analysis of our system's outputs is crucial for rapid advancement of our research agenda. Ultorg provides, by far, the best tool for visualizing and investigating our data. It is an invaluable tool for our research.”

Tables of Data
Whether in finance, engineering, operations, or the life sciences, you are likely working with tables of data in spreadsheets, CSV files, or an external database. Spreadsheets are excellent tools for managing a single table of data. They are a poor fit for database tasks, however, where data must be combined and queried in many different ways.
Ultorg is a general-purpose, graphical user interface for relational databases. That means any data that's organized into tables with rows and named columns. Behind the scenes, Ultorg generates SQL queries that execute either remotely or on your local computer.
Connect to:
- PostgreSQL
- Microsoft SQL Server
- MySQL/MariaDB
- DuckDB and Parquet
- Google BigQuery
- Microsoft Access Files (.mdb/.accdb)
- Microsoft Excel Files (.xls/.xlsx)
- Google Sheets
- CSV/TSV Files
- Other JDBC-based data sources
- In beta: Oracle, Snowflake, SQLite, Athena, Exasol


Visual Joins
A join is a fundamental database operation that combines data from two different tables, based on a common identifier such as “Room Number” or “Customer ID”. Joins are frequently needed when working with multi-table datasets.
In Ultorg, you can quickly join data from multiple tables or data sources, and interact with the result through a single, spreadsheet-like data manipulation surface.
For SQL-based data sources, Ultorg will recognize existing foreign key relationships, and suggest relevant joins. Or you can join on arbitrary fields, e.g., to combine data from a spreadsheet and a CSV file.

One-to-Many Relationships
A join between two tables will often involve a one-to-many relationship, where each row in the first table can match multiple rows in the second table.
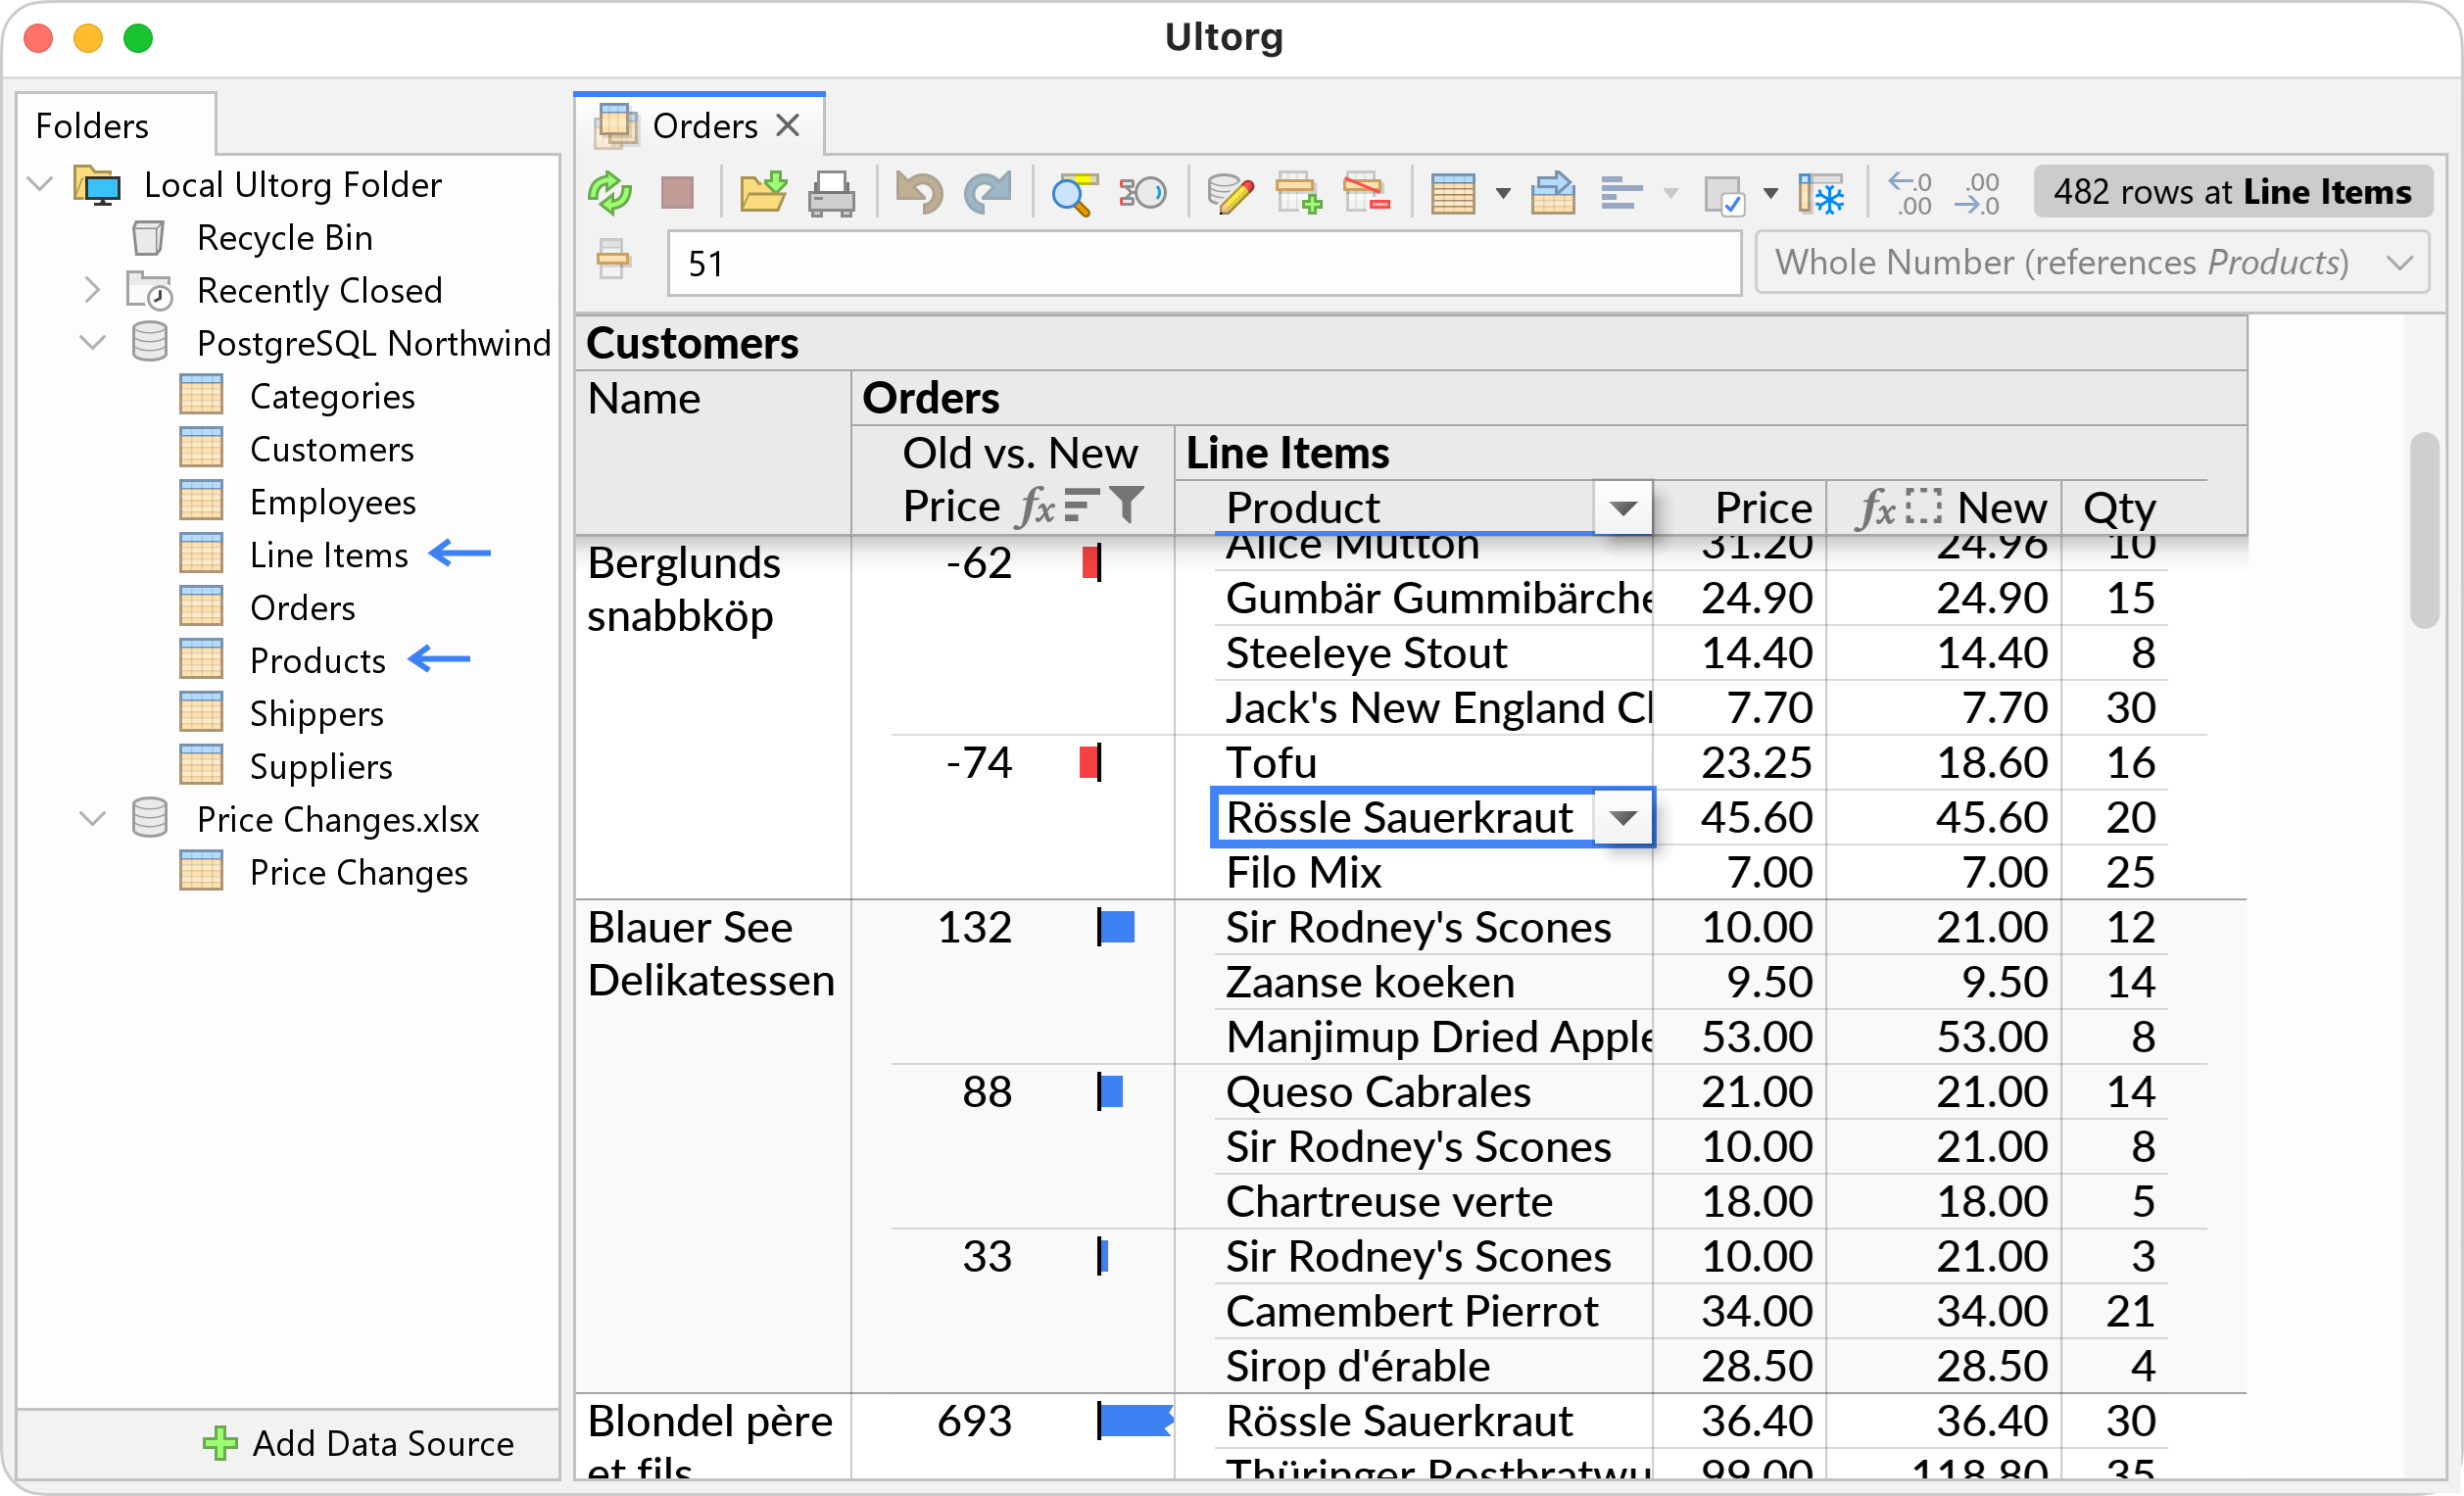
Ultorg will visualize any combination of one-to-many relationships, in a compact but readable way, using a specially developed system of visual data layouts. Sorting, filters, and formulas can be applied at any level, and joins can be chained or included side-by-side without losing or duplicating rows.
Among visual database tools, Ultorg is unique in its ability to handle one-to-many relationships in a general way.

One-to-many relationships also occur inside database queries, when grouping on fields to calculate sums or averages, or when nesting one query within another. Ultorg will visualize each stage of such data flows.
For example, you can see the individual values that contribute to a group-wise sum. This lets you audit the query visually. You can tweak filters and calculations in the input, while gaining confidence in the aggregated totals.

SQL Without SQL
At first glance, Ultorg's direct manipulation interface resembles a spreadsheet. The tabular layout you see on the screen, however, represents a real database query, which can be refreshed and modified without risking changes to the underlying raw data.
A visual query lets you see exactly the data you need for a particular business task, without descending into a code editor, form designer, or flow chart. Even for database experts, Ultorg will serve as a rapid alternative to hand-typed SQL.
Most SELECT queries that can be written in the core SQL language have a visual equivalent in Ultorg. For example, you can express arbitrary combinations of joins, filters, calculations, and subqueries.

Dynamic Autolayout
In business or engineering data, or in the social sciences, you may be dealing with hundreds of fields of various data types—text, numbers, and dates—spread across dozens of tables, each with thousands (or millions) of rows.
To retain sanity, it is essential not to have to spend time tweaking formatting settings for each individual field, or for every new database query.
Ultorg eliminates such hard, manual labor, by analyzing your data on the fly and deriving carefully tuned defaults. For example, label placements, table column widths, text field dimensions, decimal precision, and pagination are all handled automatically. You can see all your data with fewer keystrokes.
Ultorg's typographical engine can visualize records and one-to-many relationships using a combination of general-purpose strategies, such as nested tables, forms, and crosstabs.
Ultorg's visual data layouts are analogous to the hand-designed user interface screens you might see in traditional, tailored database applications. But in Ultorg, they are available immediately, for any data, without custom programming.


Create, Read, Update, Delete
From Ultorg, you can also edit data, stored in a relational database, in a Microsoft Excel workbook, or in Google Sheets.
You can edit values in individual cells, pick values from a dropdown, insert rows, or fill down, like in a spreadsheet.
You can review changes before committing to the database. Multiple users can edit at the same time.
For internal business operations, Ultorg can serve as an alternative to custom CRUD interfaces, or as a way to supercharge your spreadsheet-based recordkeeping.
Connect to Your Data, Right Now
Start Ultorg and connect immediately to your data source. No “cloud” required; all data stays private on your computer or corporate network.
 felipecortez@felipe___cortez
just connected @ultorg to the @MusicBrainz database and WOW this thing is cool hytradboi.com/2022/ultorg-a-…
 Valery Sibikovsky@combdn
Wow!
It is so refreshing to see such a revelation — a work of art in user interfaces!
(Warning: no micro-interactions, no gradients.)
 Tom Larkworthy@tomlarkworthy
This thing blew my mind for how good a SQL admin interface can be. I was pretty happy with metabase until this talk. Wow! Really wow!
 Pedro Paulo@pedrovc
This is outstanding work! The trick is how to integrate it with users' workflows. If people can leverage Ultorg without leaving Excel/Salesforce/any CRM/ERP this is massive.