Auto-Layout Engine
In traditional database applications, the user interface is hard-coded for a specific database schema, with form fields and table widgets laid out manually by a software developer.
Ultorg perspectives, by contrast, work with any fields and joins that you pick in the field selector. The visual layout of your data is generated on-the-fly, adapted to available space.
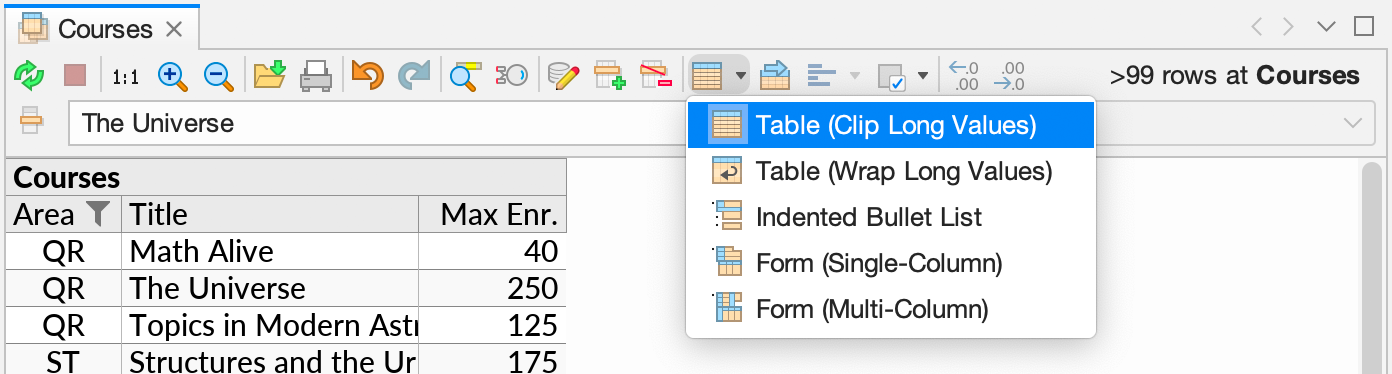
Perspectives can be configured to resemble any of the data displays you would find in a manually coded, CRUD-style database app: tables, forms and reports. In the toolbar, or via Format→Set Auto-Layout Type, you will find a list of basic layouts to start with:
Further layout options are described in the remaining pages of this chapter.
Design Philosophy
Generated visual layouts are optimized for readability and data density. When all your data can fit on the screen, fewer clicks are spent on scrolling and field selection. Or, the space that is saved by a compact layout can be invested in a larger font size (![]() Zoom In).
Zoom In).
Automatic layout decisions are made using statistical measurements of your data, to find good defaults for settings such as label placements, table column widths, and decimal precision.
Seasoned Excel users will recognize the many clicks and keystrokes that are saved by not having to tweak the format of each number, border, heading, and so on.
Nested Table Layouts
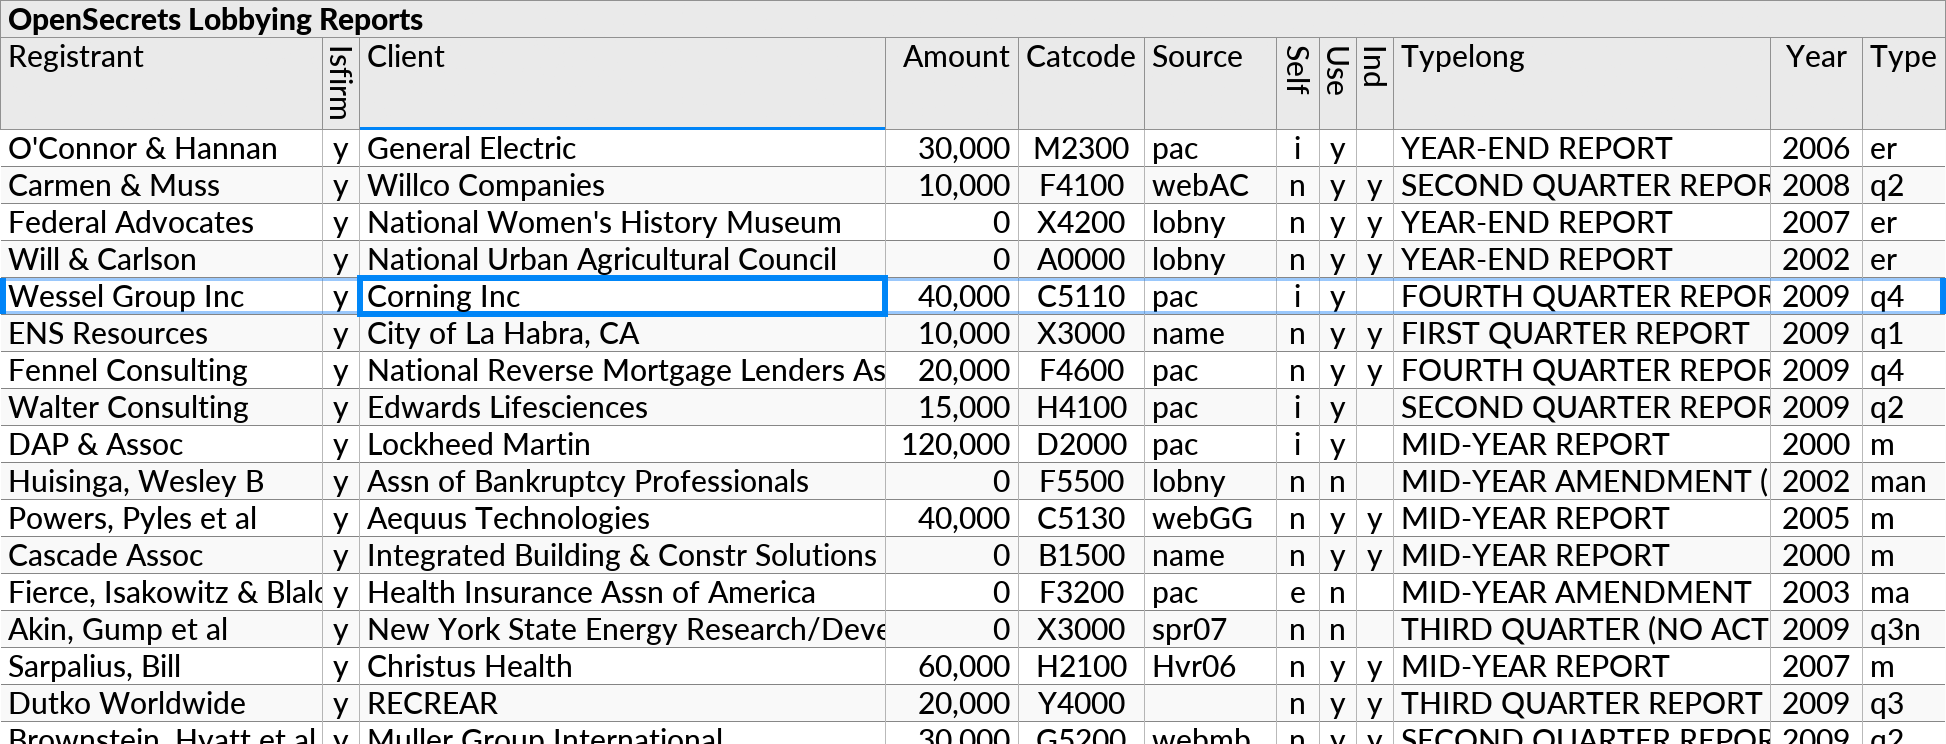
The default layout for all perspectives is a nested table. A nested table resembles a spreadsheet, but can visualize one-to-many relationships in the data, as seen in previous examples.
Nested table layouts use borders, margins, and text alignment to communicate the relationship between parent and child rows in visualized joins and subqueries. The example below shows 4 joins between 5 data tables (one for each of 5 subqueries), with both parallel and nested one-to-many relationships.
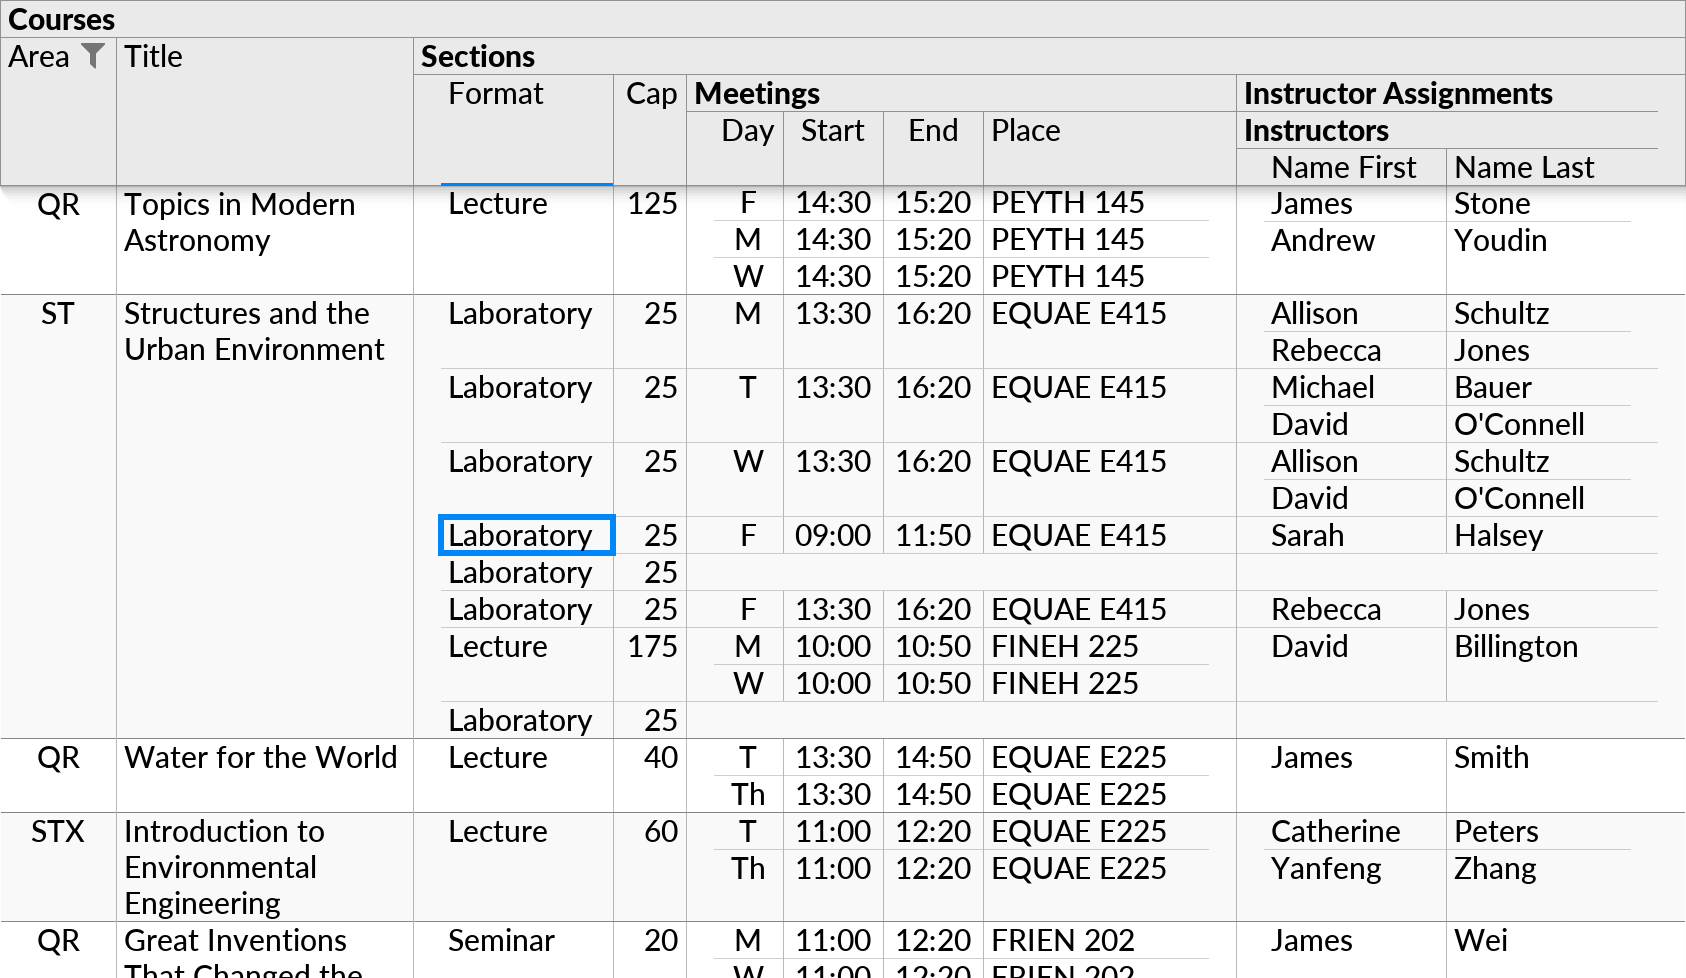
Nested table layouts use the grey header area to show the structure of fields and subqueries in the visualized database query. The result of the query appears below the header.
In the Set Auto-Layout Type dropdown in the toolbar, there are two options for a nested table: either ![]() Table (Clip Long Values) or
Table (Clip Long Values) or ![]() Table (Wrap Long Values). The two options differ only in the appearance of long text values, which can either be cut off or wrapped to make cells taller.
Table (Wrap Long Values). The two options differ only in the appearance of long text values, which can either be cut off or wrapped to make cells taller.