What is Ultorg?
Ultorg is a general-purpose user interface for relational databases, based on a PhD project[1] from the MIT Computer Science and Artificial Intelligence Laboratory.
Ultorg serves as an off-the-shelf alternative to custom database application development, for business or engineering data that may be too complex to manage in spreadsheets.
Since the 1990s, “relational databases with the ease of a spreadsheet” has been a holy grail[5] in the software industry, with new such products launched every year. We have cracked a number of hard problems that went unsolved in other systems, including the formulation of arbitrary database queries by direct manipulation[2], the proper treatment of joins and one-to-many relationships[2,4], and the automatic generation of domain-specific user interface layouts[3].
What is a Relational Database?
Tables of data! Data sources like MySQL and Oracle are called relational database management systems. Their purpose is to store data that has been organized neatly in tables with rows and named columns. Values in one table can be used to look up rows in another table.

This simple convention lets you represent any kind of business data, including relationships between different types of business objects.
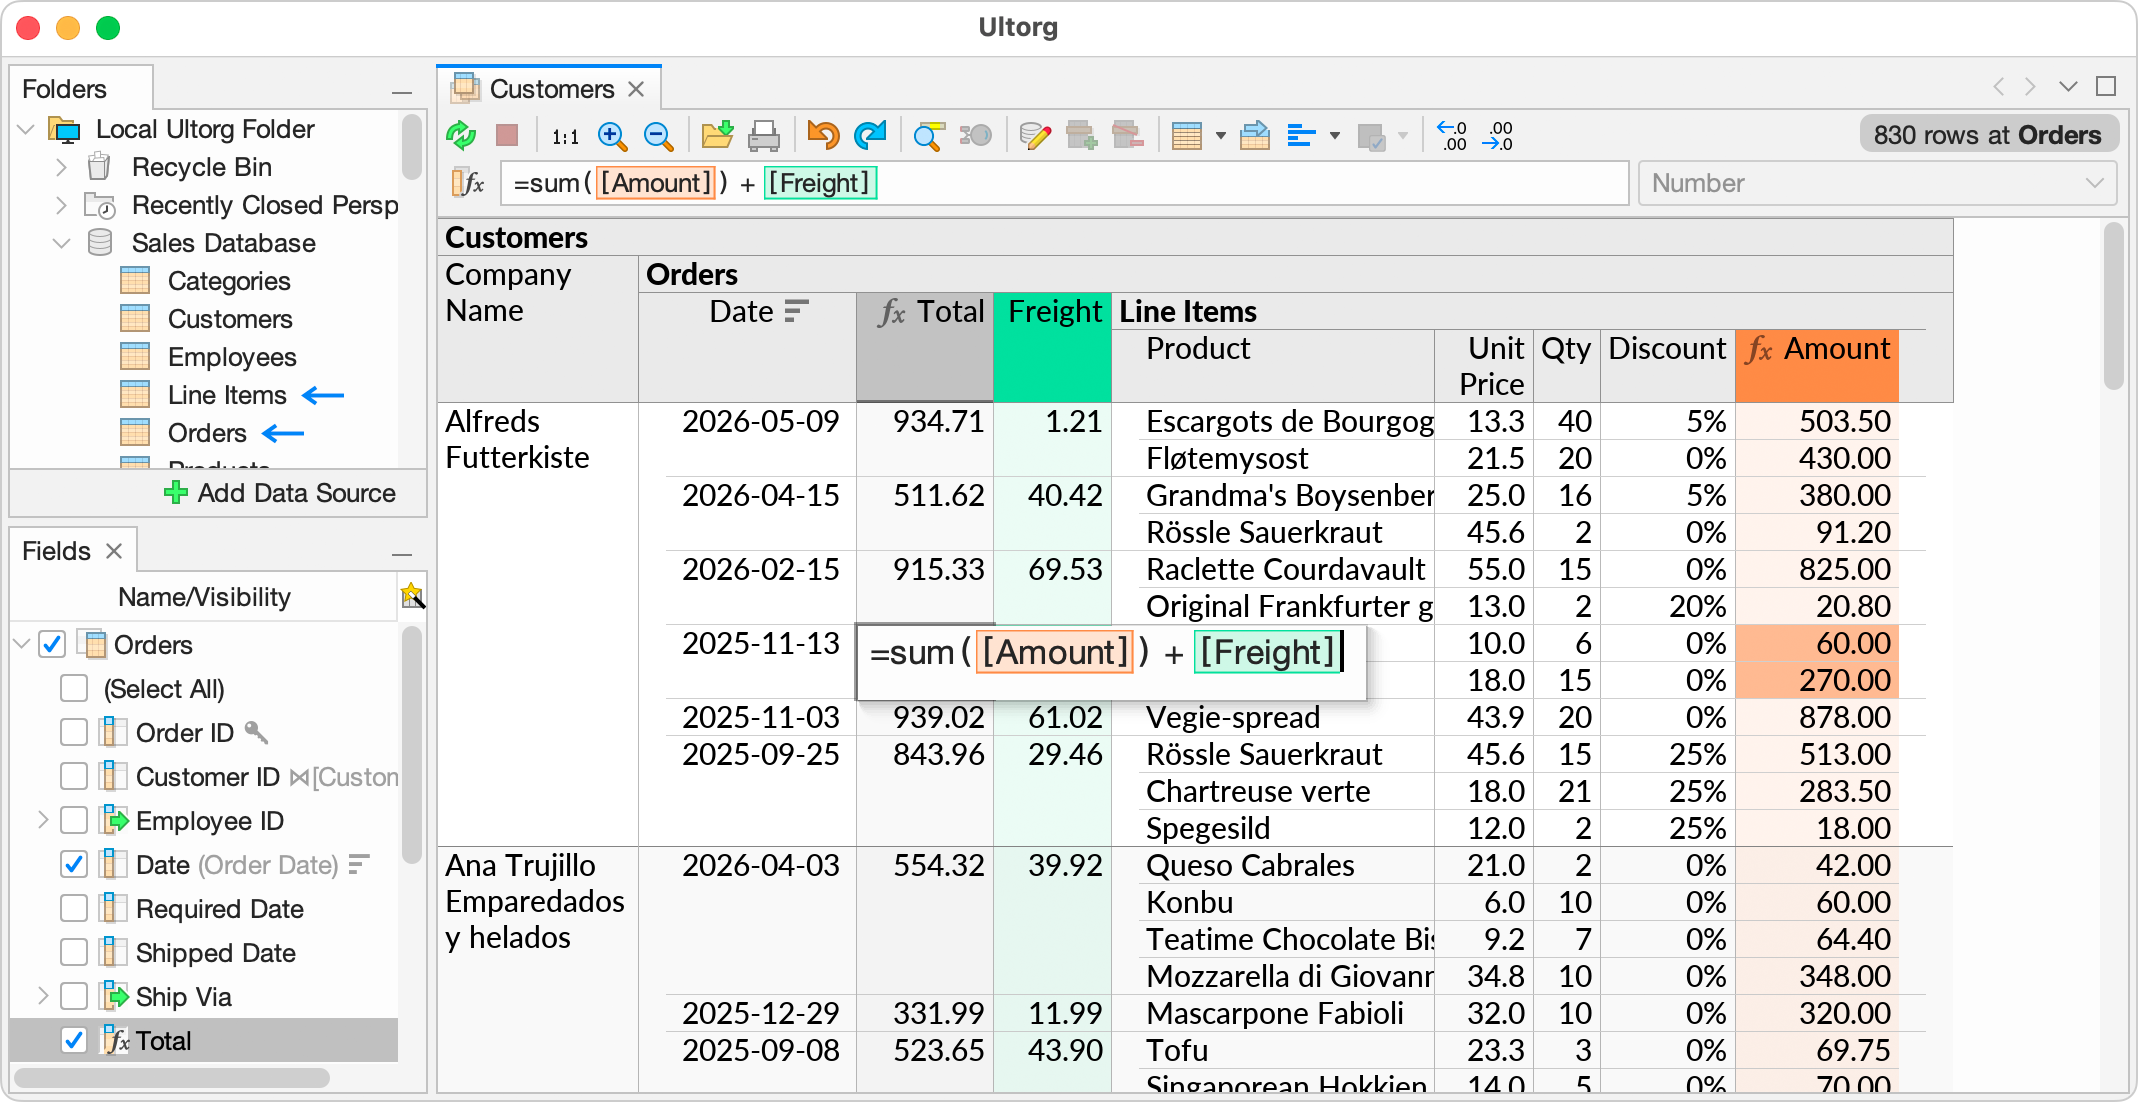
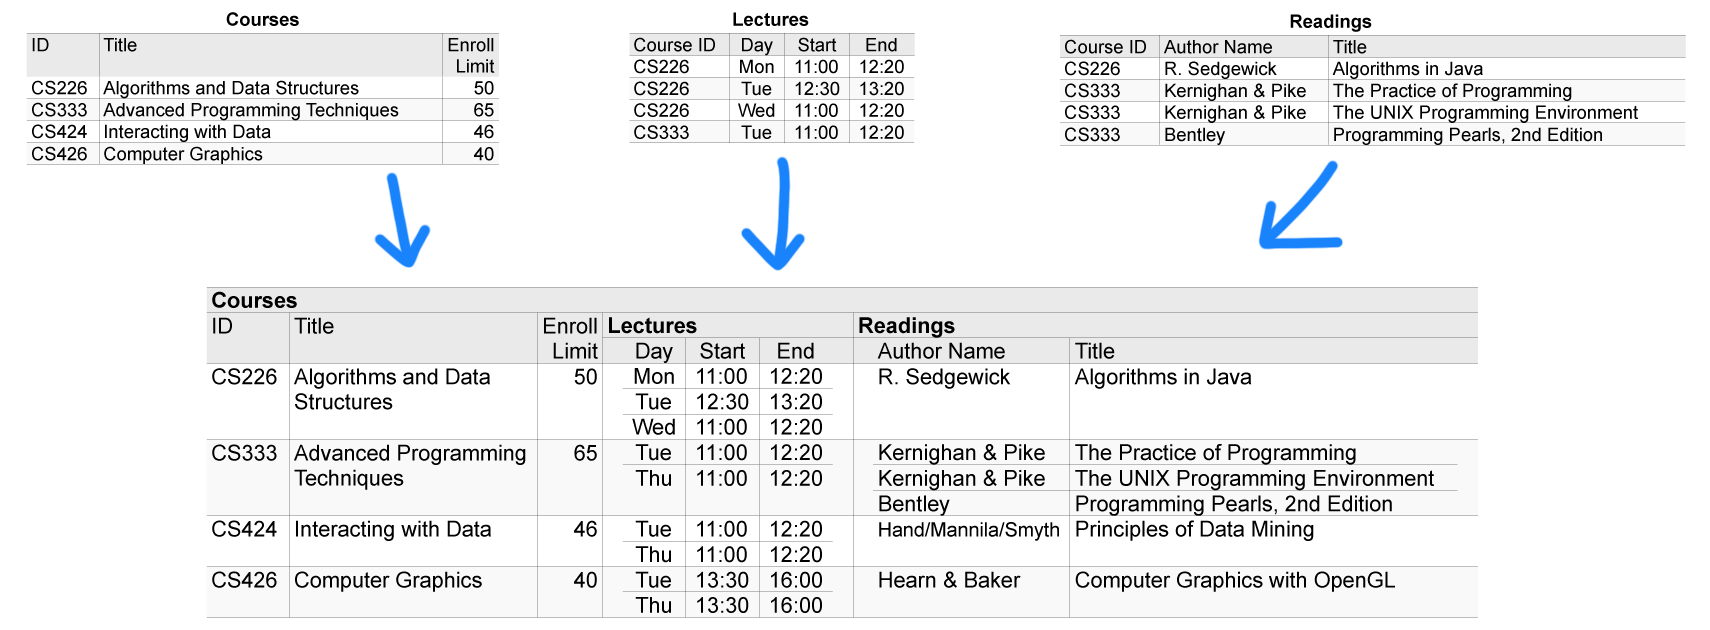
In Ultorg, a single perspective may show data from multiple database tables. For example, the data from the previous example may be shown in the nested table below. See Join Visualization in Ultorg for more details.

Database Schemas
The specific configuration of tables and relationships is known as a schema. Below are four examples of database schemas, each designed for a different use case. The crow's foot symbol (![]() ) indicates one-to-many and many-to-many relationships.
) indicates one-to-many and many-to-many relationships.

In a well-designed (normalized) database schema, each piece of information is stored and updated in a single official place. This keeps data clean and consistent over time.
Ultorg lets you treat any collection of tables as a relational database, even if they are stored in, say, Excel files, Google Sheets spreadsheets, or a combination of other data sources.
Ultorg works well with either normalized or de-normalized schemas.
Database Queries
Relational data tends to be scattered across many tables. The data can be combined back again in useful ways, using a so-called database query. Traditionally, database queries are defined with the specialized computer language SQL (pronounced “sequel”). In Ultorg, by contrast, you construct queries by interacting with the data itself, in a spreadsheet-like environment.
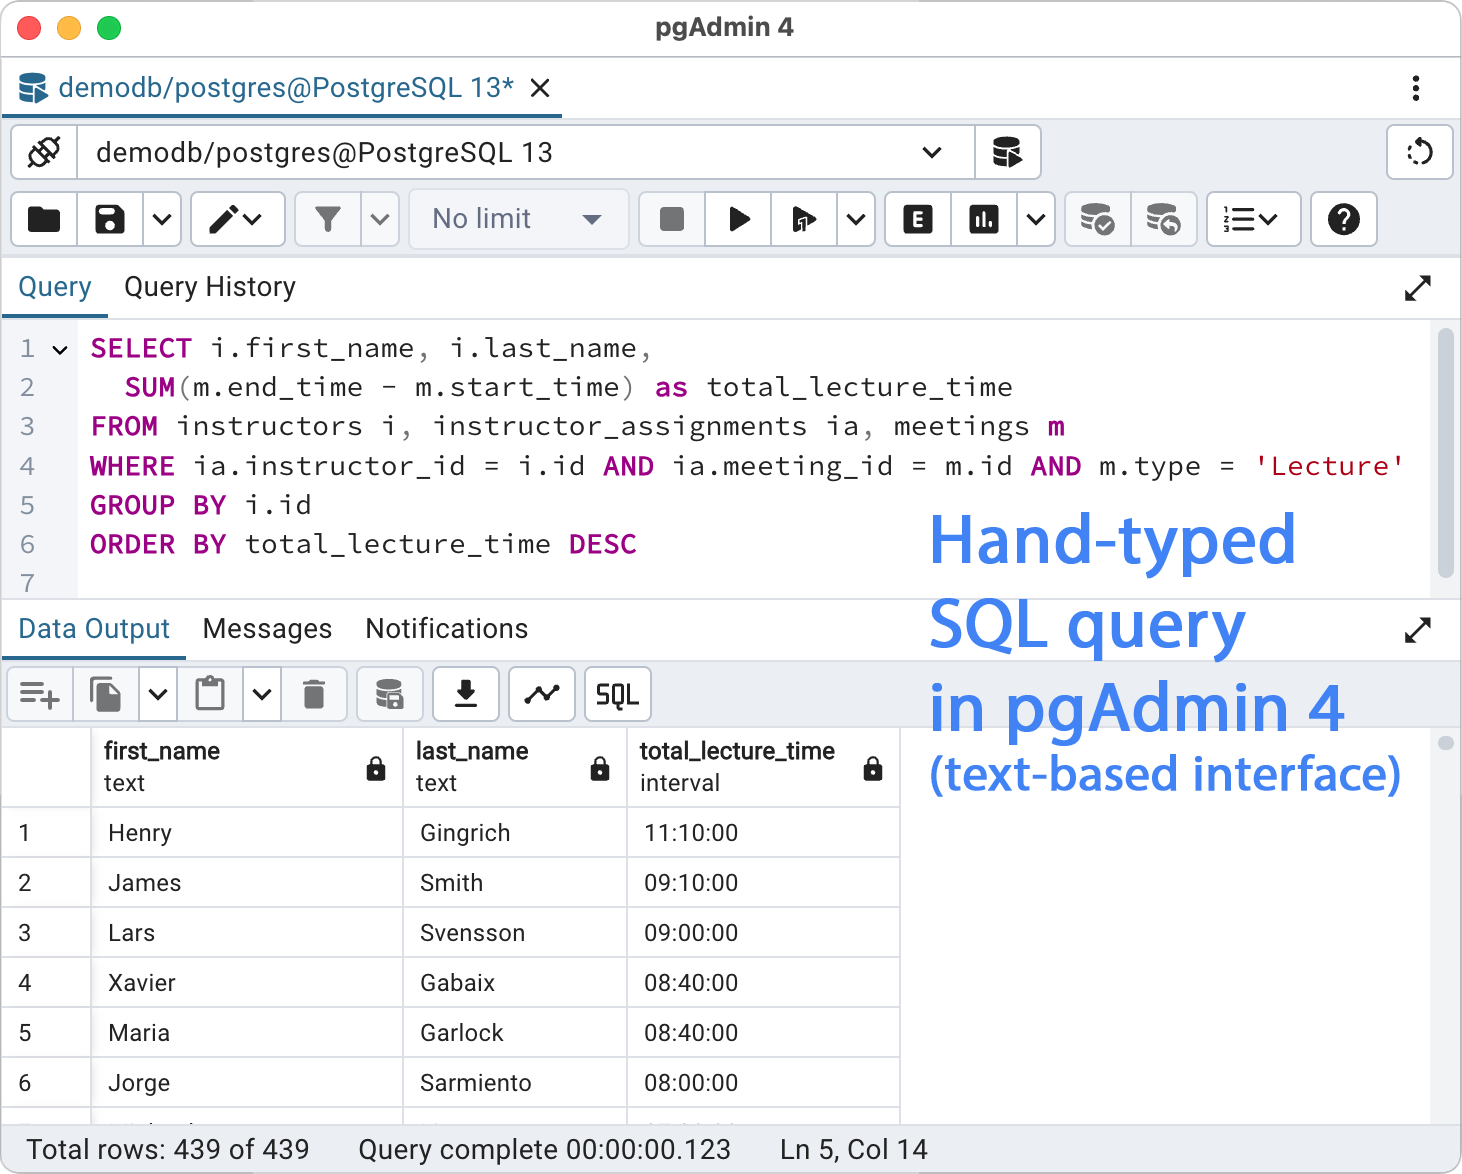
Below is an example of a manually written SQL query, pulling data from three tables.
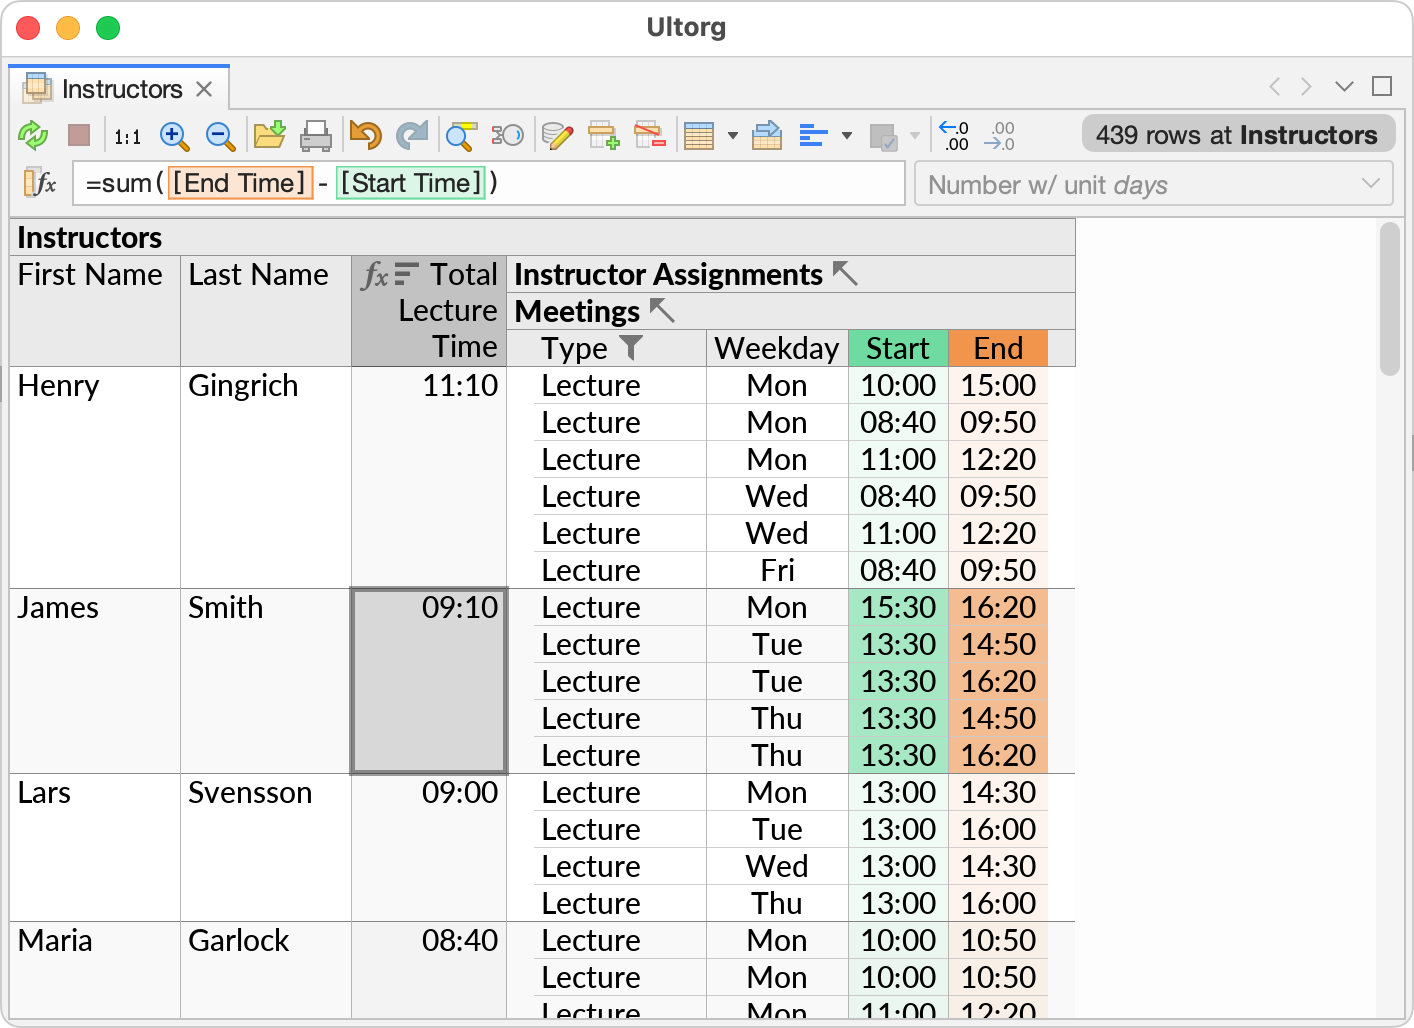
Below is an equivalent visual query in Ultorg, with a spreadsheet-like formula highlighted.
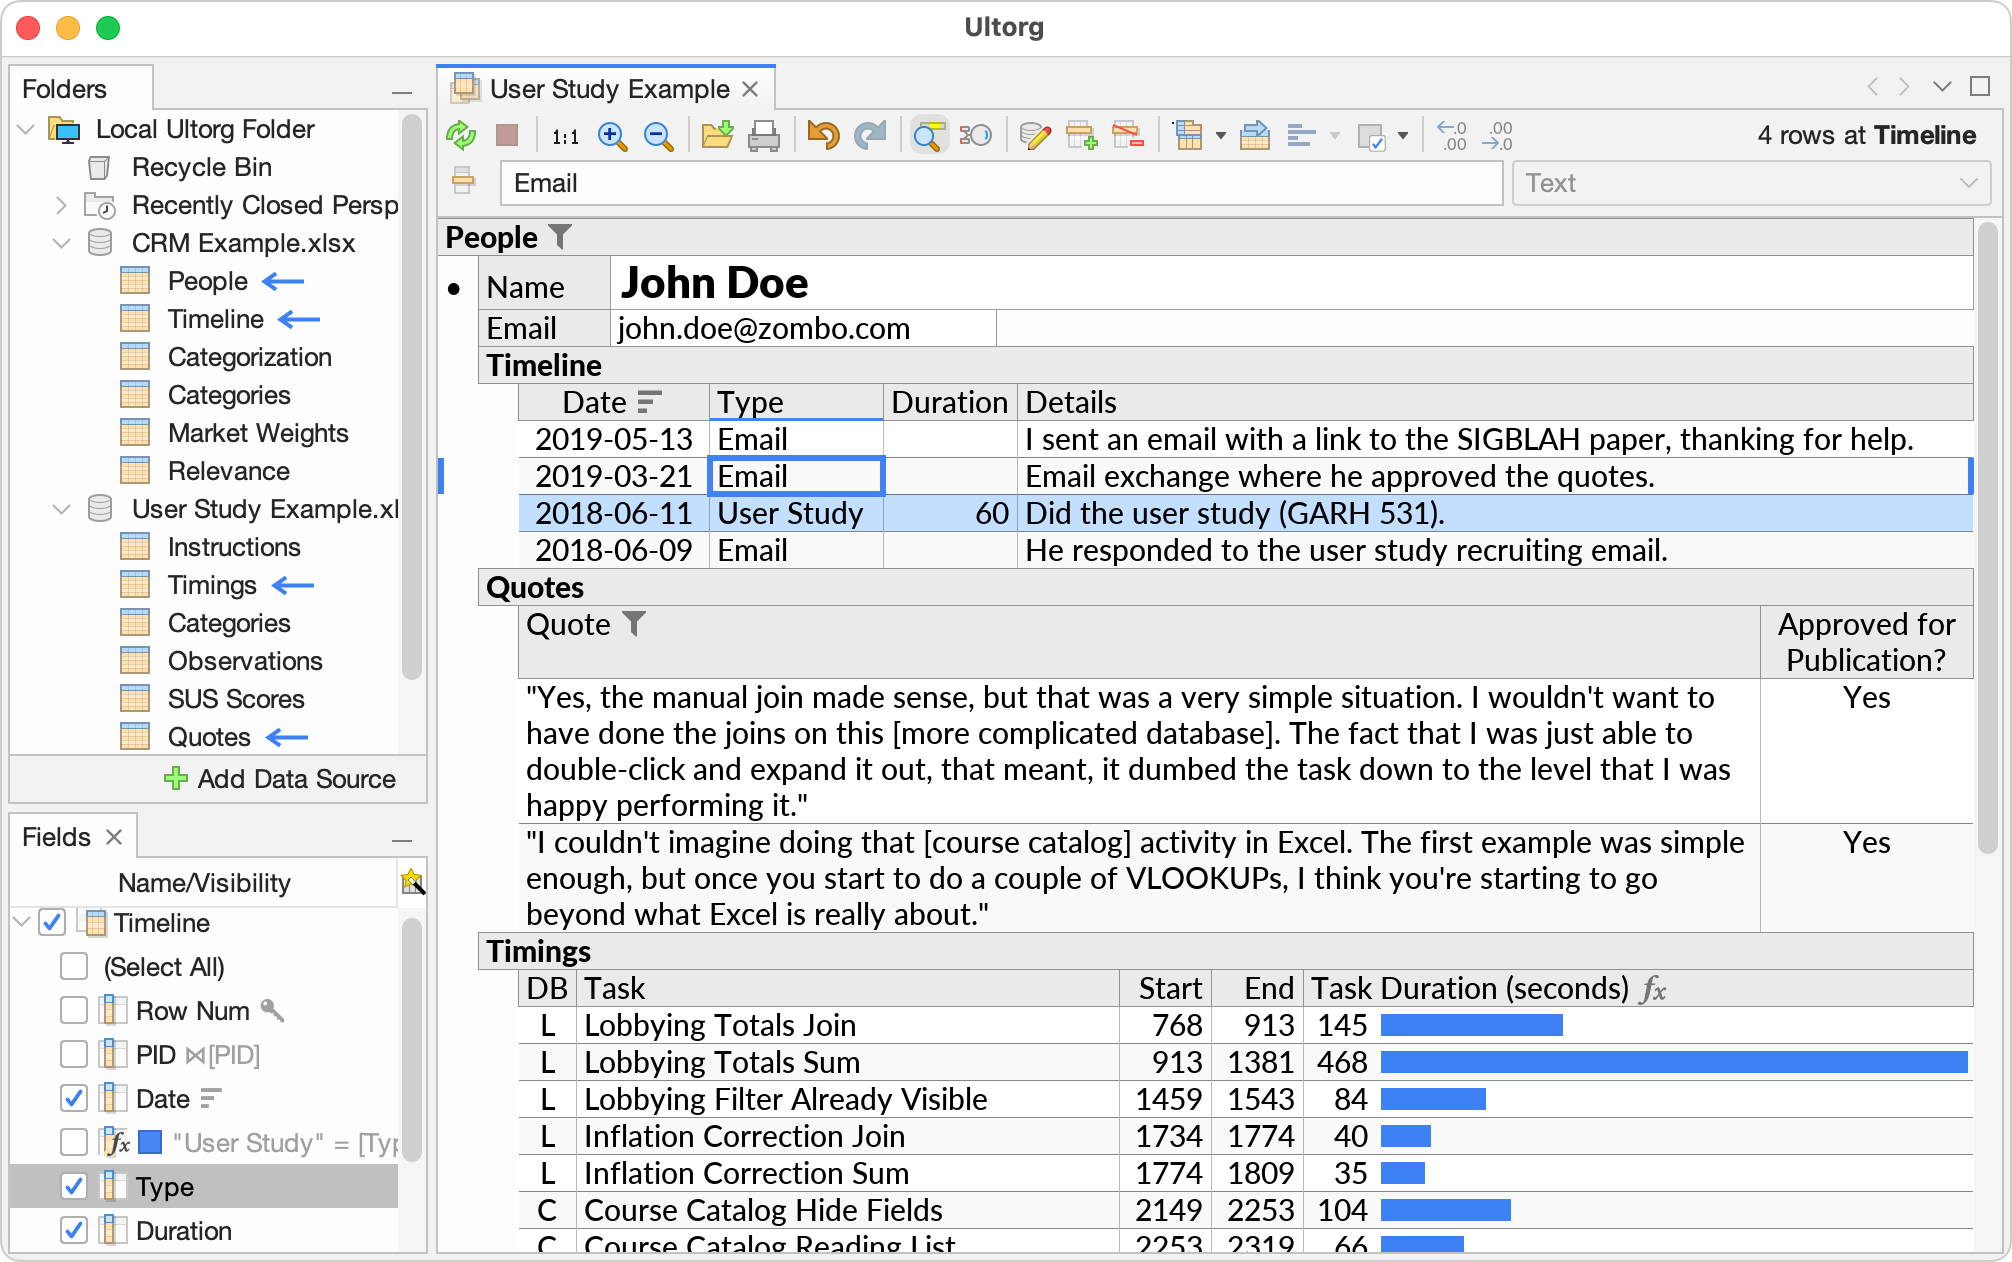
By defining the right database queries, you can retrieve data in exactly the form that is needed for a given business task. In Ultorg, this extends to the presentation of data into tables, forms, reports, and crosstabs.
The ability to see relational data from different perspectives, without having to copy and paste data around, is a core advantage of databases over spreadsheets. In Ultorg, such perspectives can be created very rapidly and then evolve further during data exploration.
CRUD Apps and BI Tools
Our industry loves jargon. Most user-facing database applications are one of two kinds:
- CRUD apps are used in daily business operations. They “create, read, update, and delete” records in a database, to manage all kinds of industry-specific business objects.
CRUD (or “OLTP”) database schemas tend to have many interconnected tables and relationships, carefully organized (normalized) to avoid duplication of data. Each CRUD app is hand-designed for one particular database schema.

- Business Intelligence (BI) tools are used to analyze historical data. Here, the user looks at aggregations of data rather than individual records, in a read-only manner.
BI tools work best with single-table databases, or with schemas that have been specifically designed for analytical use. These are known as OLAP, “snowflake”, or “data warehouse” schemas. Tables often include a large number of columns, to avoid lookups (joins).

Ultorg can be used for both CRUD and BI tasks, but has advantages over traditional tools:
- Unlike CRUD apps, Ultorg is completely schema-independent. It works on any relational database that you connect to, regardless of the exact shape of your data.
- Unlike BI tools, Ultorg can visualize database schemas of arbitrary complexity, including heavily normalized databases with interconnected relationships. Raw data can be displayed and edited from an efficient, table-oriented user interface.
What About NoSQL?
Ultorg displays joins and one-to-many relationships using a special tree-structured visualization. This is a trick that is done at the user interface level only. The actual data is retrieved from the simple, flat tables of a relational database.
For software engineers, the nested structure of Ultorg's visualizations may resemble that of a JSON document. In fact, we can generate a JSON version of Ultorg's output for illustration:
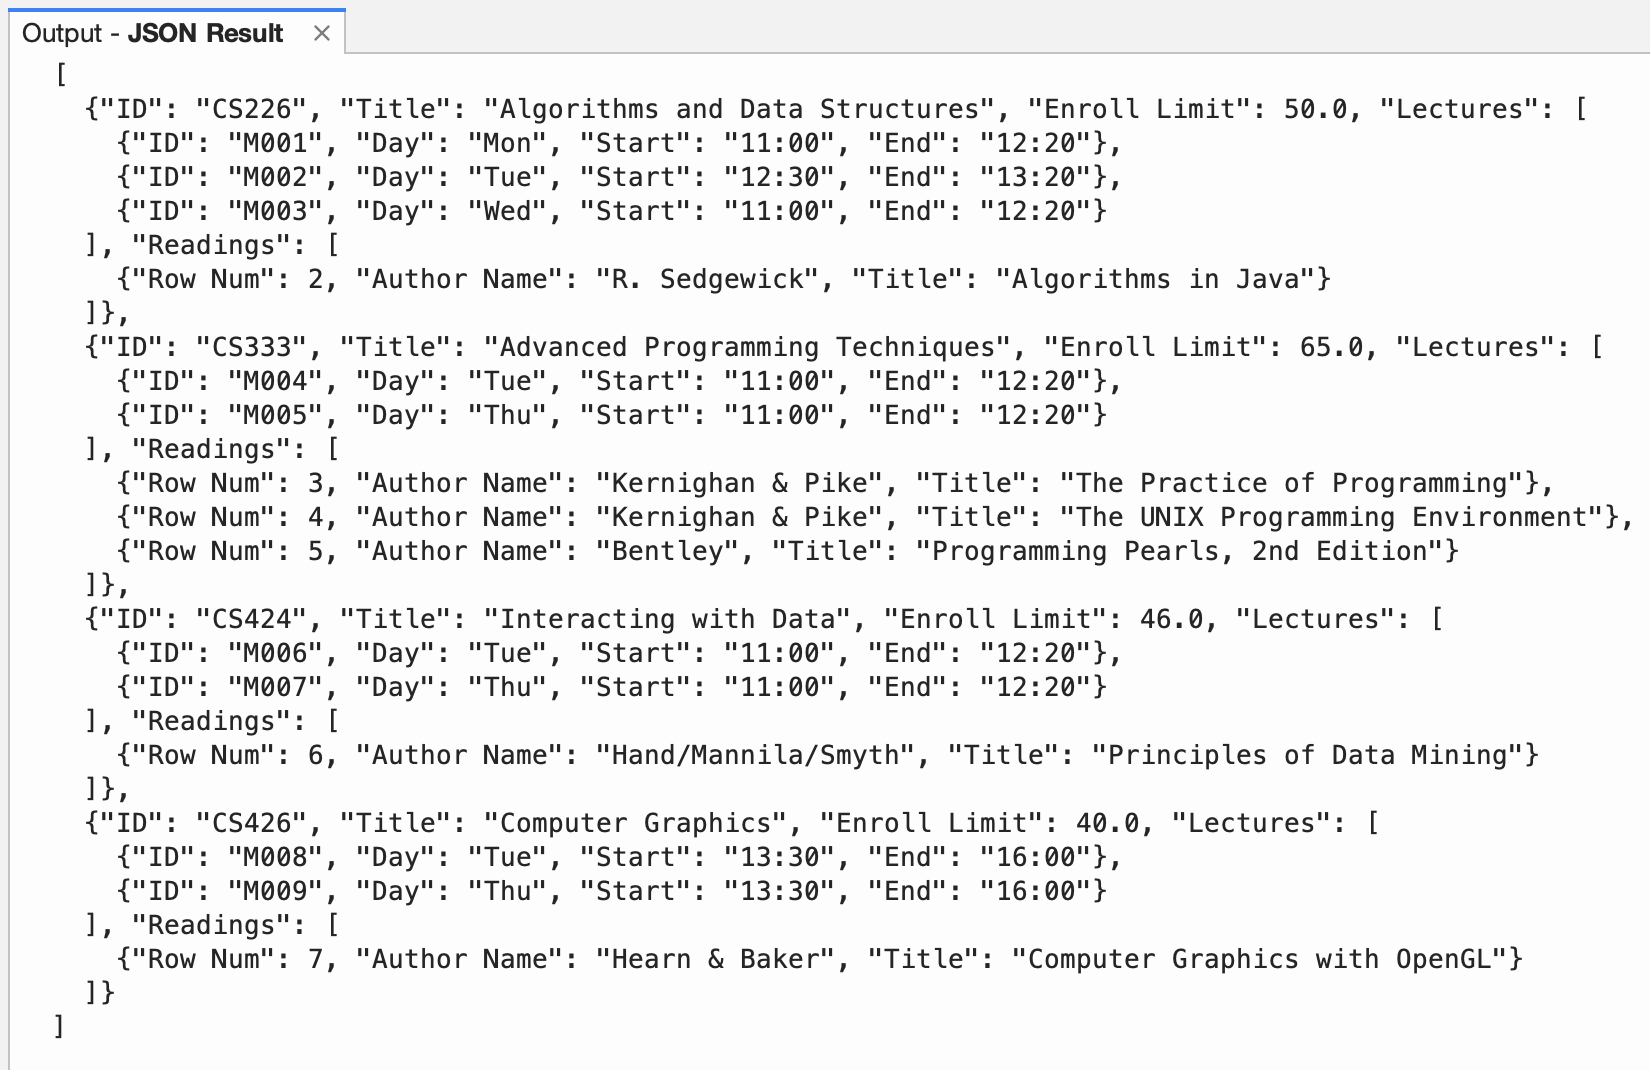
Certain database products, such as MongoDB, will actually store data in this manner. These are called “NoSQL” databases.
By storing data in a hierarchical format, with relationships already resolved, NoSQL databases avoid the need for join operations. This, however, limits the the ability to traverse relationships in multiple directions. Data must be displayed as it is stored.
Ultorg prefers the SQL approach, where data is stored in flat tables that can be joined together on demand. This keeps the source data in the simplest possible form, and lets you view it from whatever perspective you need at any given time.
That said, many relational databases will let you store JSON data in a table column. You can work directly with such values in Ultorg. See JSON Features for more information.